Figure 1:

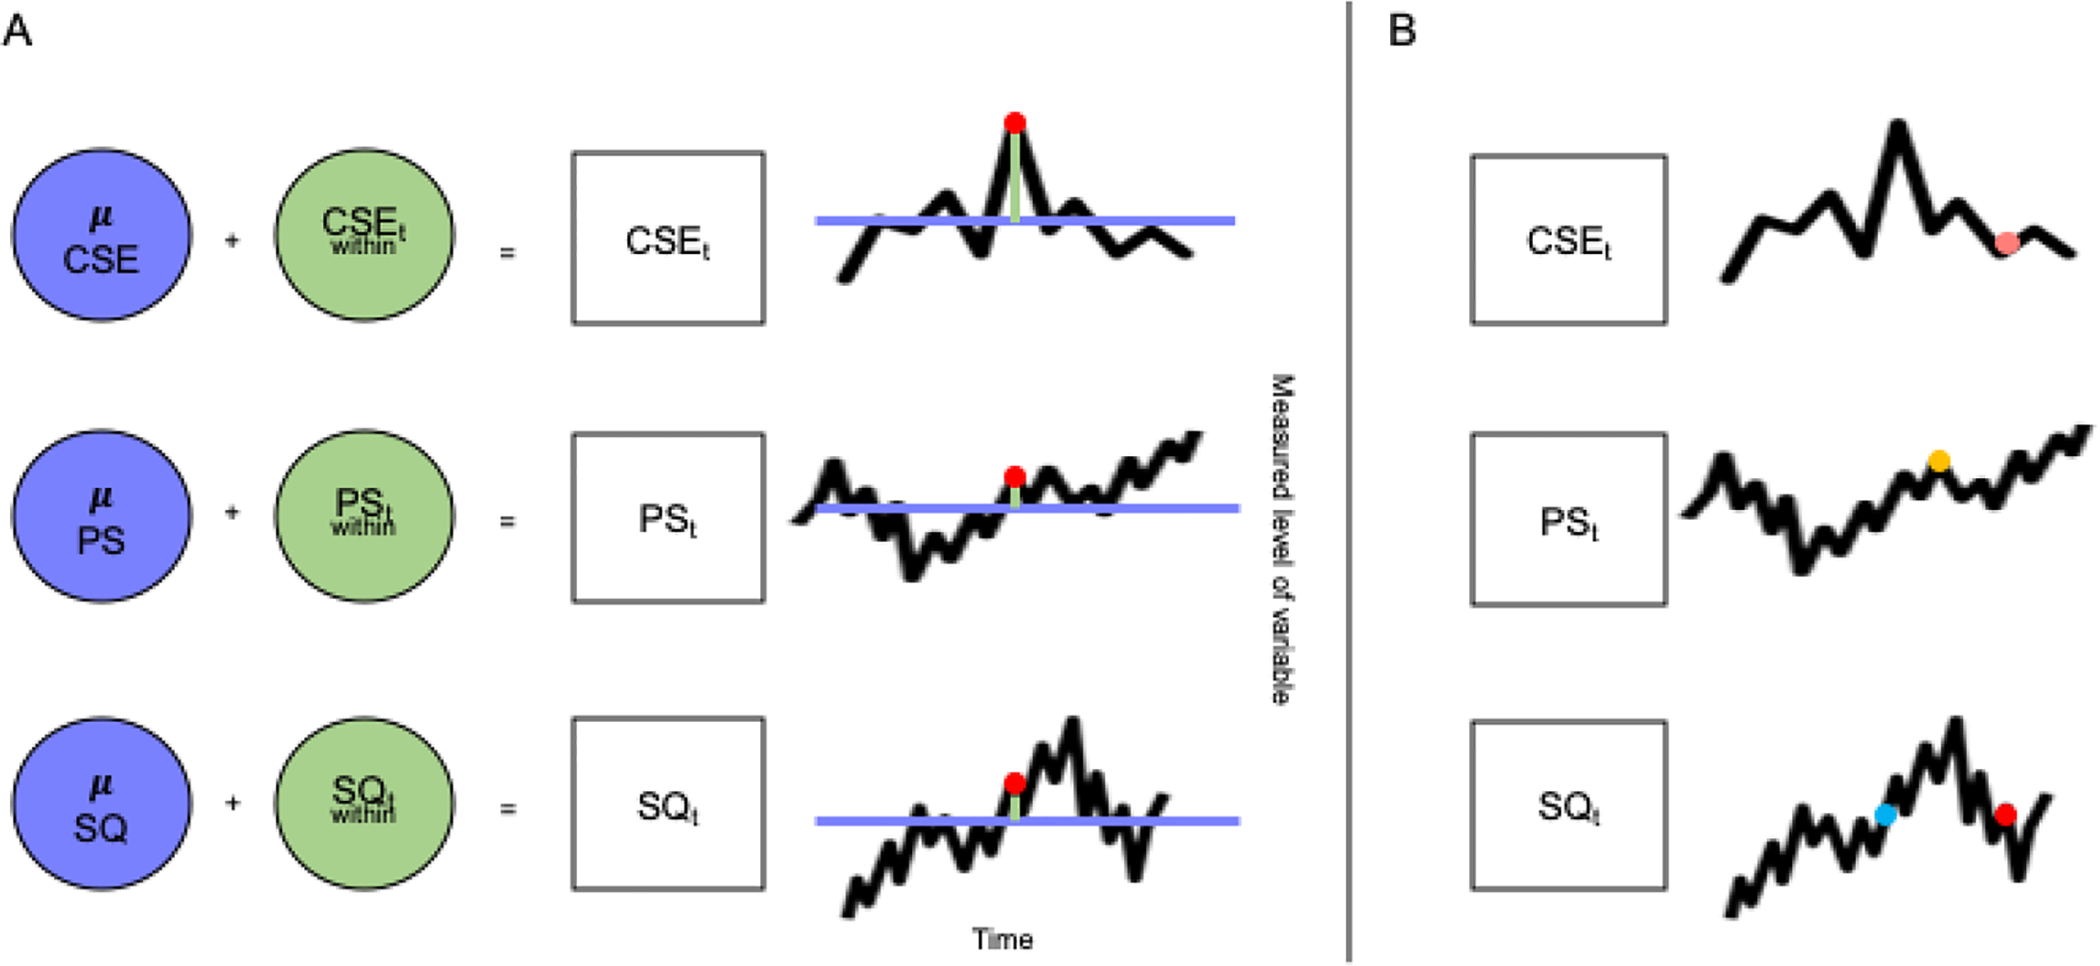
A: An Idealized Representation Breaking Down the Variables of Interest into Between-Person and Within-Person Components. Coping self-efficacy (CSE), perceived stress (PS), and sleep quality (SQ) time series measurements can be separated into between-person (purple) and within-person (pale green) components. A given measurement at timepoint t (represented by a red dot) can be decomposed into a mean across the individual’s entire time series of measurements (represented by the purple horizontal line) as well as a deviation at timepoint t from the participant’s individual mean (represented by the pale green line).
“μ” indicates the mean level of the variable, and the subscript t indicates a measurement at a given timepoint.
B: An Idealized Representation of Temporal Associations in Dynamic Structural Equation Models (DSEM). DSEM makes it possible to model how a variable, for example sleep quality, at timepoint t (represented by a red dot in the bottom time series) is predicted by 1) itself at an earlier timepoint (represented by a blue dot), called an auto-regressive association; 2) another variable at the same timepoint t (in this example, coping self-efficacy, represented by a pink dot in the top time series); or 3) another variable at an earlier timepoint (in this example, perceived stress, denoted by a yellow dot in the middle time series).
