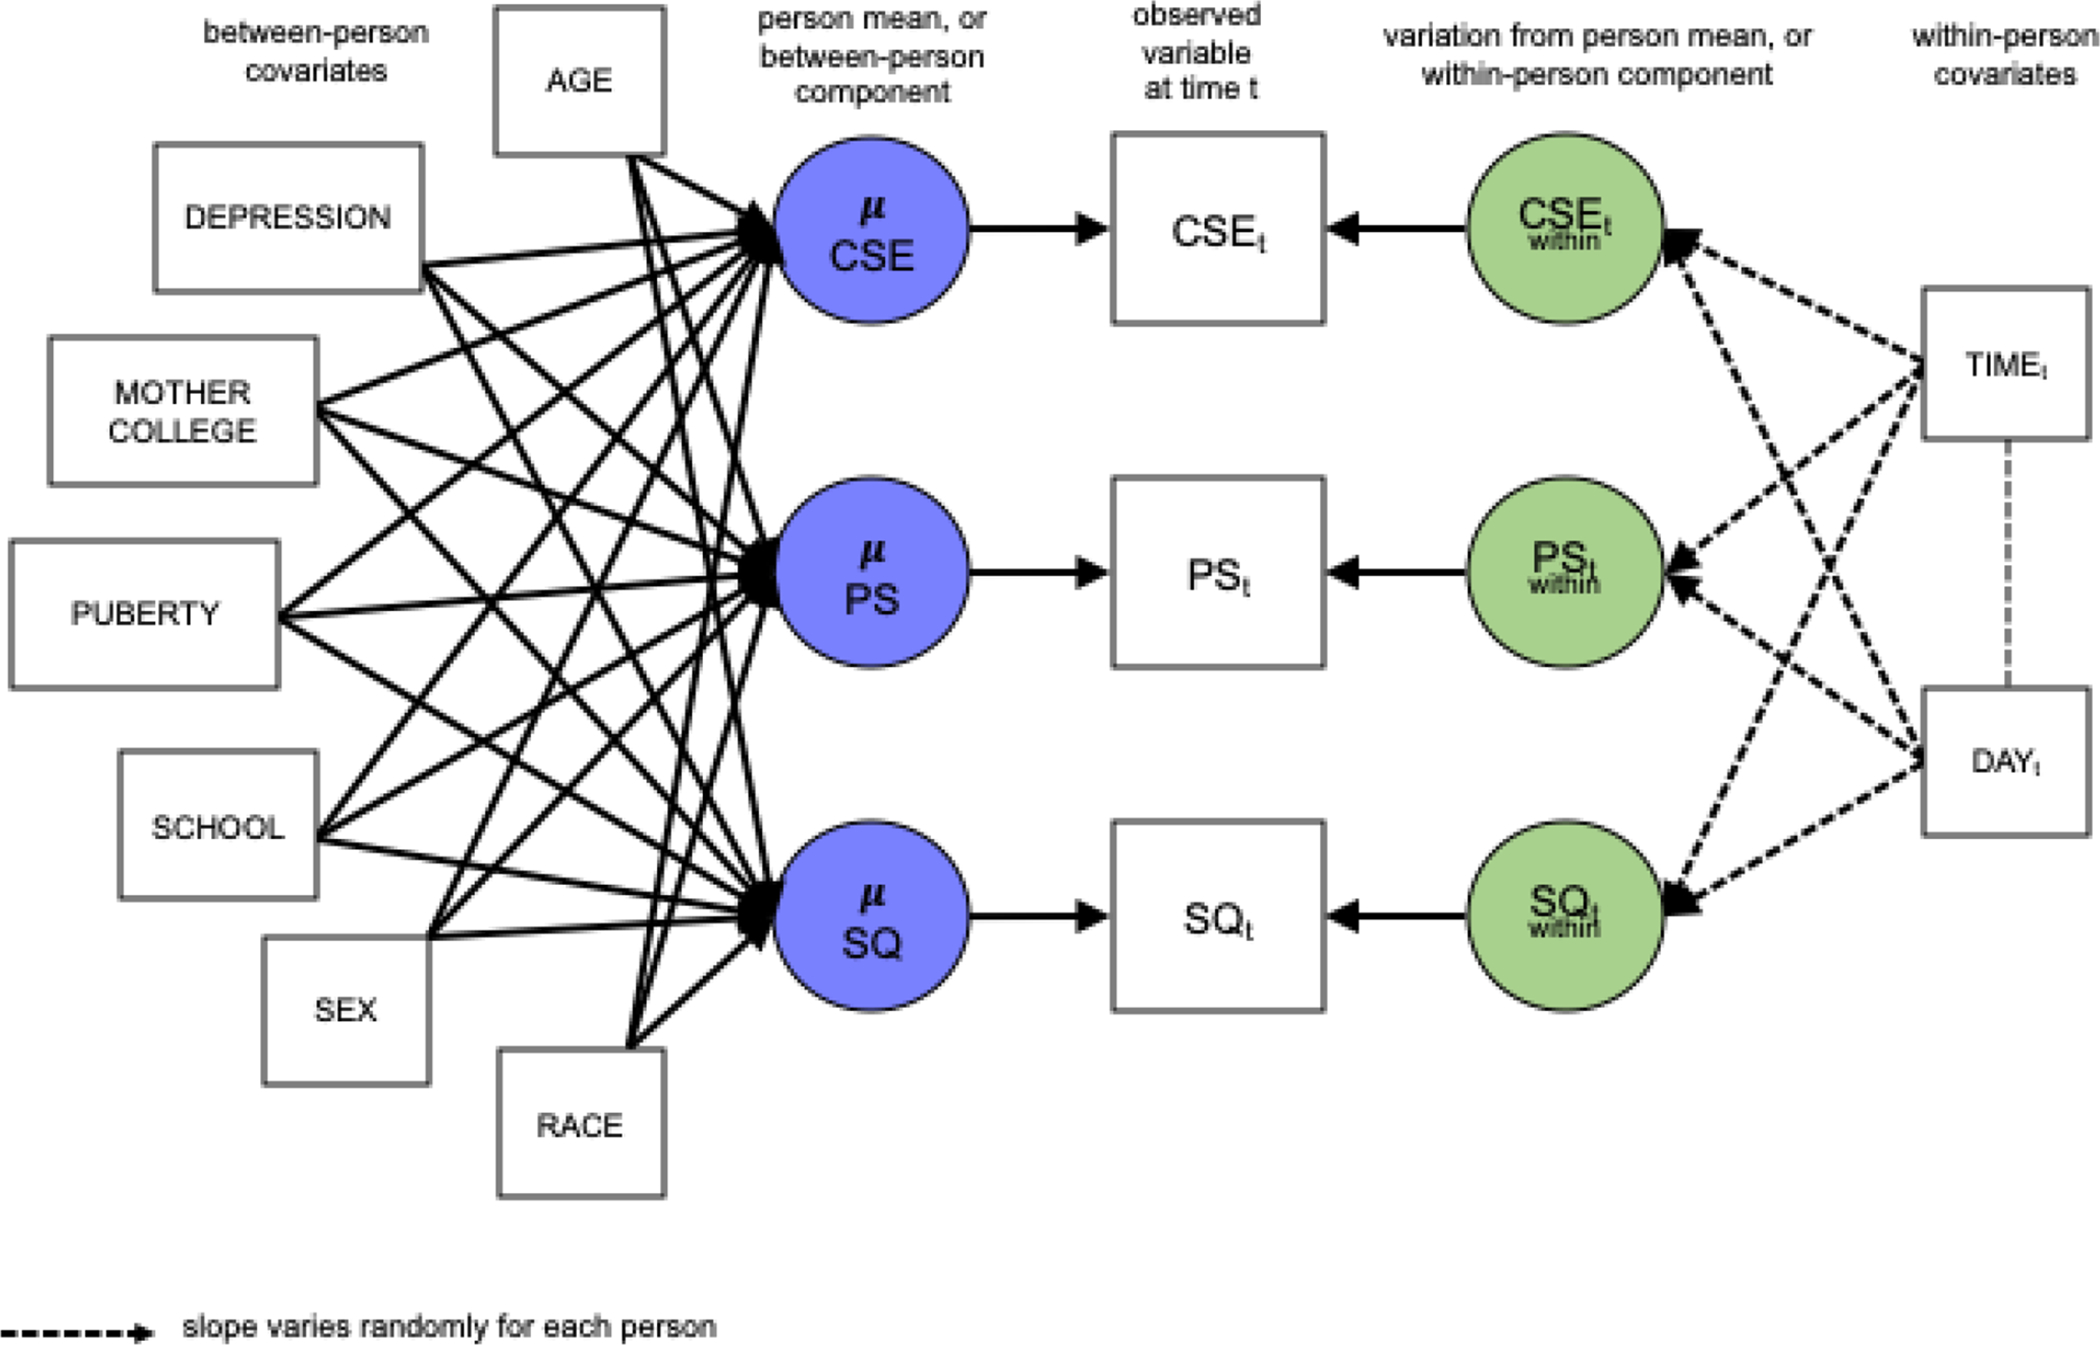
Figure 2: A Representation of Hypothesized Model Associations.

This figure visually represents the full specification of the dynamic structural equation model (DSEM). Observed variables of coping self-efficacy (CSE), perceived stress (PS), and sleep quality (SQ) measured daily across two weeks are denoted with squares, and latent variables are denoted with circles. Observed variables are constructed from latent between-person (purple) and within-person (green) components. Dotted arrows indicate that paths are allowed to vary for each individual. To test a hypothesis that a given path (represented with a line) in the DSEM is significant, the MPlus software calculates a conditional estimate given all other paths in the model and 95% Bayesian credible intervals, which indicate whether the true value of the conditional estimate is likely to include 0 (indicating no association).
“μ” indicates the mean level of the variable, and the subscript t indicates a measurement at a given timepoint.
