. 2021 Jul 5;10:e57376. doi: 10.7554/eLife.57376

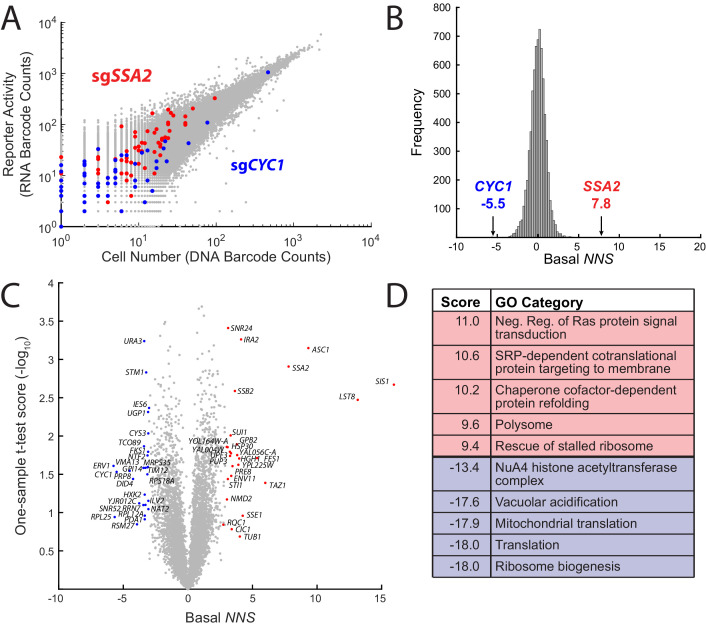
Figure 2. ReporterSeq reveals genome-wide basal regulators of the heat shock response.

(A) Comparison of DNA and RNA barcode counts from wild-type, untreated yeast. Red dots indicate barcodes that correspond to sgRNAs targeting the Hsp70 chaperone, SSA2. Blue dots indicate barcodes that correspond to sgRNAs targeting CYC1, a gene that shares significant homology with the Hsf1-driven synthetic reporter. (B) Histogram of the basal NNS for sgRNAs targeting each gene. NNS for SSA2 and CYC1 gene targets are indicated. (C) Plot of the basal NNS for every genetic knockdown. Outliers and genes mentioned in the text are labeled. (D) Table of the gene ontology (GO) categories with the five highest and five lowest scores in the basal screen.

Figure 2.

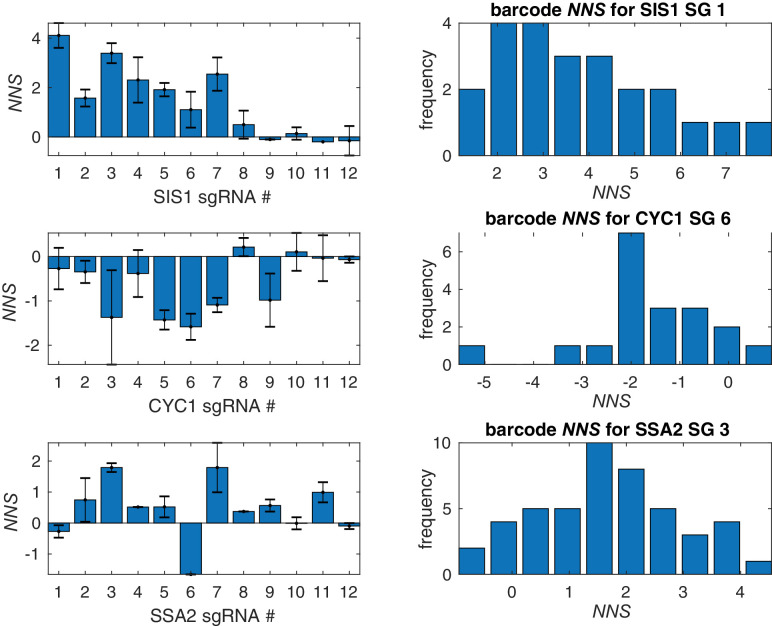
Figure 2—figure supplement 1. Barcode and sgRNA specific effects on HSR reporter.

Figure 2—figure supplement 1.

Average HSR NNS for each of 12 sgRNAs for three top screen hits, SIS1, SSA2, and CYC1. For each gene, a histogram of barcode NNS for the top scoring sgRNA is shown. Error bars represent S.E.M.
Figure 2—figure supplement 2. Top hits are dependent upon HSE sequence of HSR reporter.
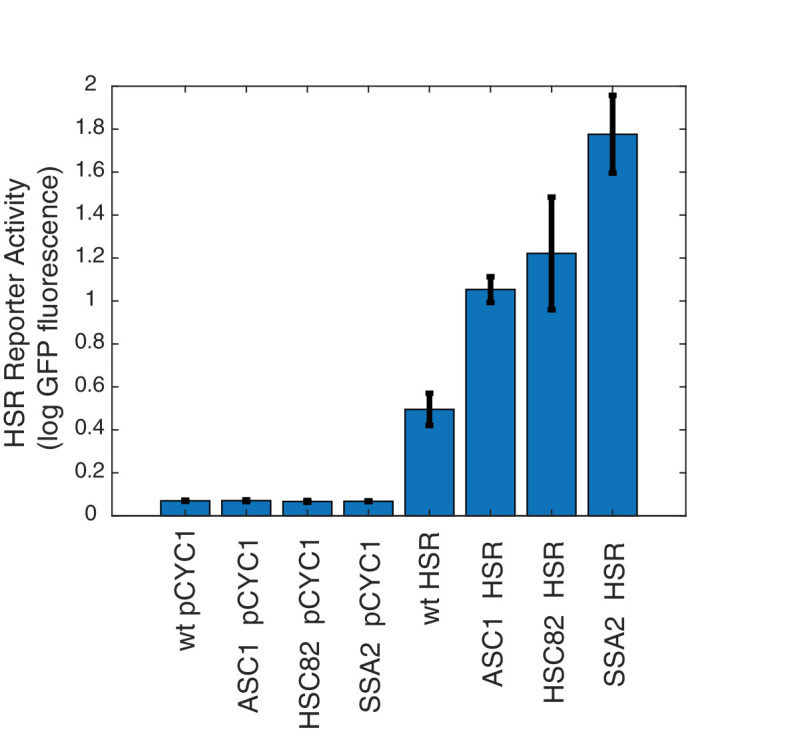
Figure 2—figure supplement 2.

Levels of HSR reporter and matched control with HSE sequences removed, leaving only a cryppled CYC1 sequence, in selected deletion strains. Error bars represent S.E.M. of triplicates.
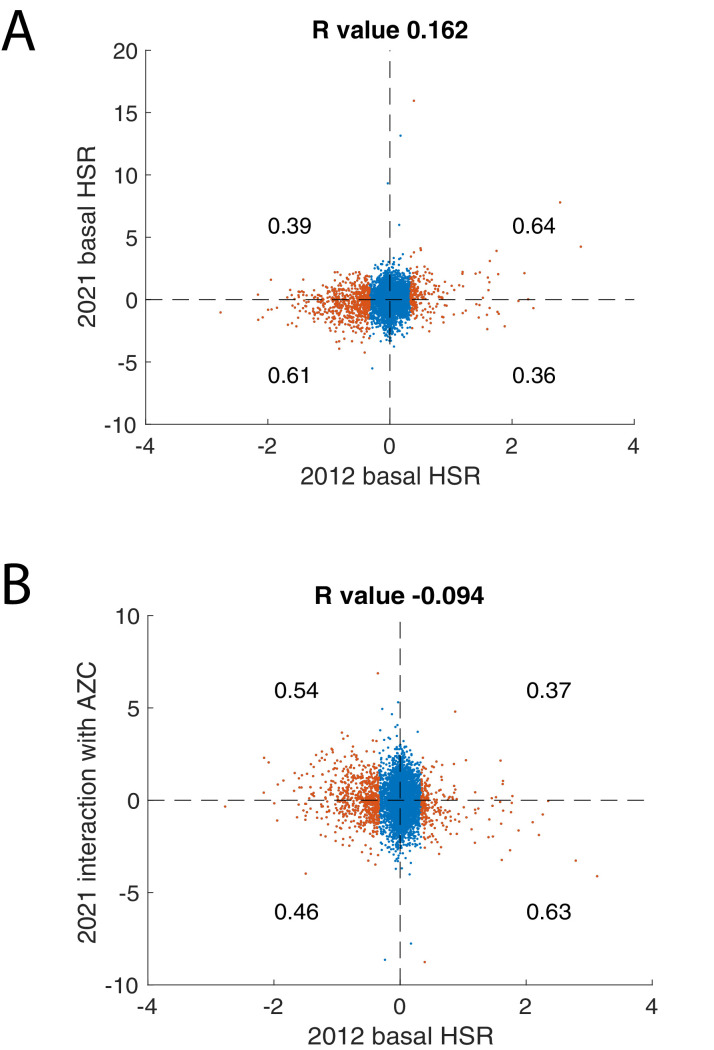
Figure 2—figure supplement 3. Comparisons of ReporterSeq screen with previous HSR screen.

Figure 2—figure supplement 3.

(A) Comparison between basal regulators of the HSR from Brandman et al., 2012 on the x-axis (log2 Hsf1 reporter – measured as GFP/RFP) versus ReporterSeq basal NNS on the y-axis. (B) Comparison between basal regulators of the HSR from Brandman et al., 2012 on the x-axis versus ReporterSeq interaction NNS with AZC on the y-axis. Blue points represent genes below one standard deviation from the mean and red points represent genes above one standard deviation from the mean in 2012 screen. Proportion of red points above and below zero in 2021 screen is written in each quadrant. R values from Spearman correlation appear in panel titles.