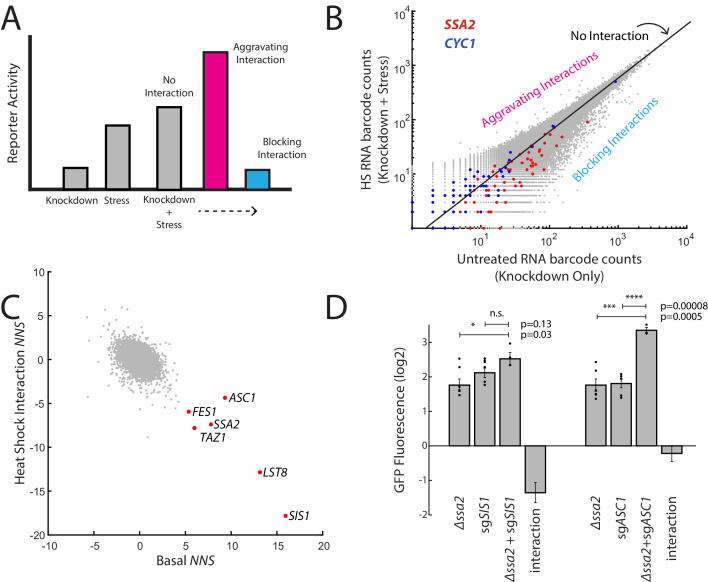
Figure 3. ReporterSeq reveals how genes interact with heat stress.
(A) A schematic of gene–stressor interactions. The combination of a gene perturbation and stressor can be additive (no interaction, suggesting independence), higher than expected (an aggravating interaction), or lower than expected (a blocking interaction). (B) RNA barcode counts of untreated yeast compared to those of heat-stressed yeast from the same sample. No interaction, aggravating, and blocking interactions are indicated. Red dots indicate barcodes that correspond to sgRNAs targeting SSA2. Blue dots indicate barcodes that correspond to sgRNAs targeting CYC1. (C) Basal NNS for each gene versus the heat shock interaction NNS for each gene. Genes with high basal NNS are labeled. (D) Genetic interactions for Δssa2-sgSIS1 and Δssa2-sgASC1 gene pairs. GFP fluorescence of the HSR reporter in the ssa2 knockout alone, an sgRNA alone, and both perturbations together are displayed, each relative to wild-type cells containing the reporter. The genetic interaction is the observed combined log2 reporter activity minus the reporter activity in each individual genetic perturbation. Error bars are standard errors of three to six replicates. p-values are calculated based on an unpaired t-test: n.s.p>0.05; *p<0.05; **p<0.01; ***p<0.001; ****p<0.0001.

