. 2021 Jul 5;10:e57376. doi: 10.7554/eLife.57376

Figure 4. Time-resolved interactions between genetic knockdowns and heat stress.

(A) Time course of interaction NNS for each gene with 39°C heat shock. Time points were measured at 10, 20, 40, and 120 min. (B) Heat map of interaction NNS for selected genes in the screen. (C) Heat map of GO category scores for selected categories with differential effects in early and late time points.

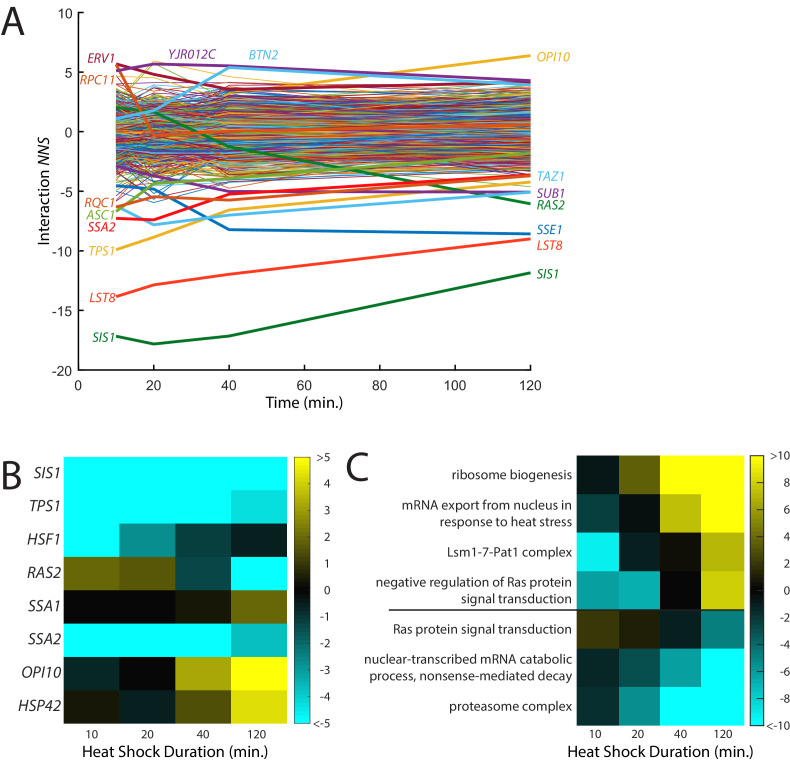
Figure 4.

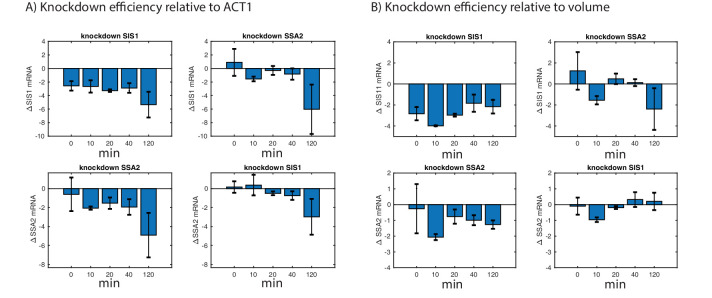
Figure 4—figure supplement 1. Effect of heat shock on CRISPR knockdown efficiency.

Figure 4—figure supplement 1.

Changes in SIS1 and SSA2 mRNA levels after 39°C heat shock in strains expressing dCas9-Mxi1 and guide sequences targeting SIS1 or SSA2 vs a scrambled control. Y-axis shows the log2 difference in mRNA levels obtained using qPCR in SIS1/SSA2 vs scramble. Results are shown for ACT1 normalized mRNA levels (A) and non-normalized mRNA levels. Note that the drop in mRNA levels at the 120 min time point is caused by an increase in ACT1 levels and thus is not recapitulated in non-normalized data. (B) Error bars represent S.E.M. of triplicates.