. 2021 Jul 5;10:e57376. doi: 10.7554/eLife.57376

Figure 5. ReporterSeq reveals the diversity of responses to different stress conditions.

(A) HSR reporter mRNA induction based as measured by qPCR in 13 stressors (see Supplementary file 6 for details of treatments). mRNA levels are relative to ACT1 mRNA levels, and the results are normalized such that untreated yeast have an induction of 0. Error bars are standard errors of three replicates. (B) Interaction NNS for each gene under each stressor. Genes with a score magnitude greater than four are labeled (with no more than 12 per condition) and colored based on annotated function. (C) Heat map of interaction NNS for select genes with each stressor. (D) GO category scores for each gene under each stressor. Category ID number key is provided in Supplementary file 7. Outlier categories are colored based on function. (E) Heat map of GO category scores for selected GO categories and each stressor. (F) Hierarchical clustering tree based on gene-stressor interactions. Relatedness between each pair of stressors is quantified by the horizontal length from the branch point.

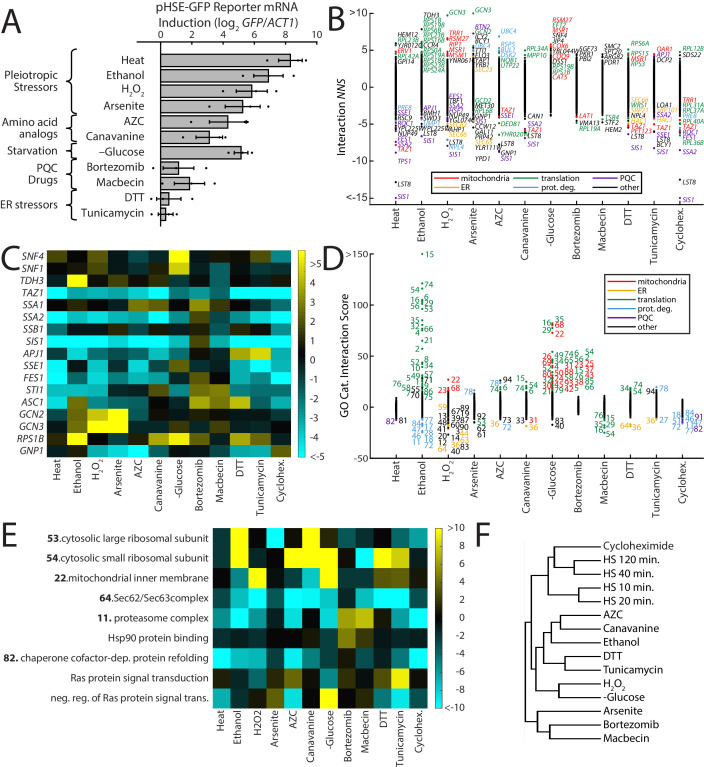
Figure 5.

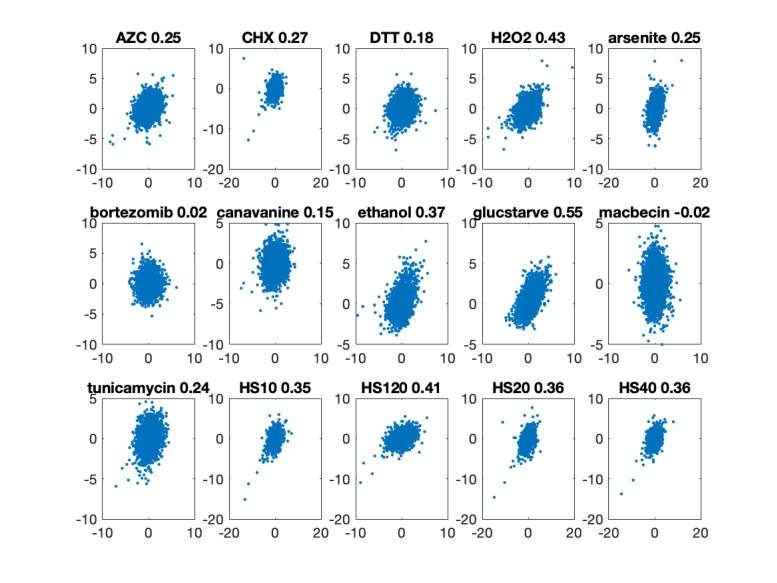
Figure 5—figure supplement 1. Replicates of gene–stressors interactions.

Figure 5—figure supplement 1.

For each stressor, gene NNS for replicates are shown. R values appear in panel titles.
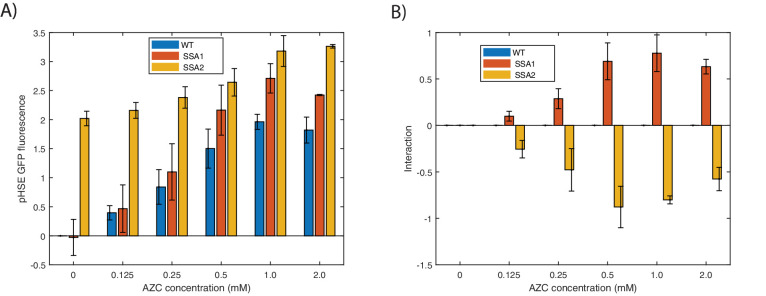
Figure 5—figure supplement 2. SSA1 and SSA2 have distinct effects on the HSR.

Figure 5—figure supplement 2.

(A) Integrated HSR reporter activity in ssa1Δ and ssa2Δ strains subject to AZC at the indicated concentration for 3 hr. (B) Interactions between AZC and Δssa1/2. Interactions between conditions are calculated as the measured result minus the expected results (sum of log scores for individual conditions). Error bars represent S.E.M. of triplicates.
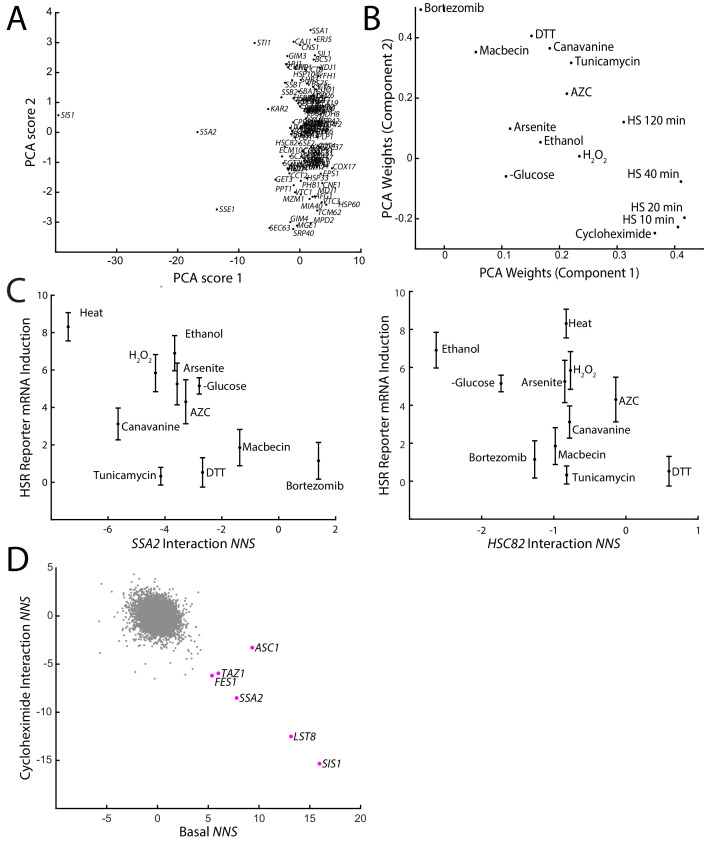
Figure 5—figure supplement 3. Comparisons of proteotoxic stressor effects on the HSR.

Figure 5—figure supplement 3.

(A) Principal component analysis (PCA) scores 1 and 2 of the interaction NNS of chaperones with all 15 stress conditions. (B) PCA weights of each stress condition for principal components 1 and 2 in PCA analysis from (A). (C) HSR reporter mRNA induction versus the interaction NNS of SSA2 (left) and HSC82 (right) with each stressor. (D) Basal NNS versus cycloheximide interaction NNS for each gene. Genes with a high basal NNS are labeled. Error bars represent S.E.M. of triplicates.