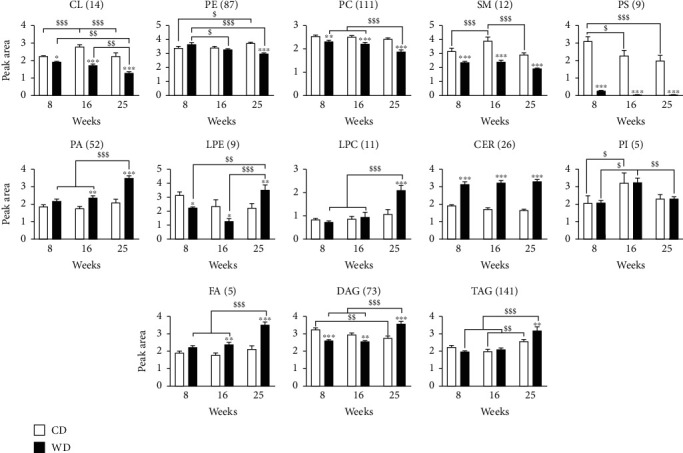
Figure 3.

NAFLD alters mitochondrial lipid species. LC-HRMS semiquantification analysis of lipids extracted from the mitochondria-enriched fraction of the liver. After identification of the individual lipid signatures, lipids were grouped in families by adding the individual peak areas. The number of lipid species is indicated between brackets. Peak area values are arbitrary. CL: cardiolipins; PE: phosphatidylethanolamine; PC: phosphatidylcholine; SM: sphingomyelin; PS: phosphatidylserine; PA: phosphatidic acid; LPE: lysophosphoethanolamine; LPC: lysophosphatidylcholine; CER: ceramide; PI: phosphatidylinositol; FA: fatty acids; DAG: diacylglycerol; TAG: triacylglycerol. (a, b) Data are expressed as mean + /−SEM; 2-way ANOVA with subsequent Bonferroni or 2-way ANOVA with rank with Tukey post hoc test; ∗p < 0.05, ∗∗p < 0.01, and ∗∗∗p < 0.001 versus control diet; $p < 0.05, $$p < 0.01, and $$$p < 0.001 versus weeks of diet. n = 7–10 mice per time point and condition.
