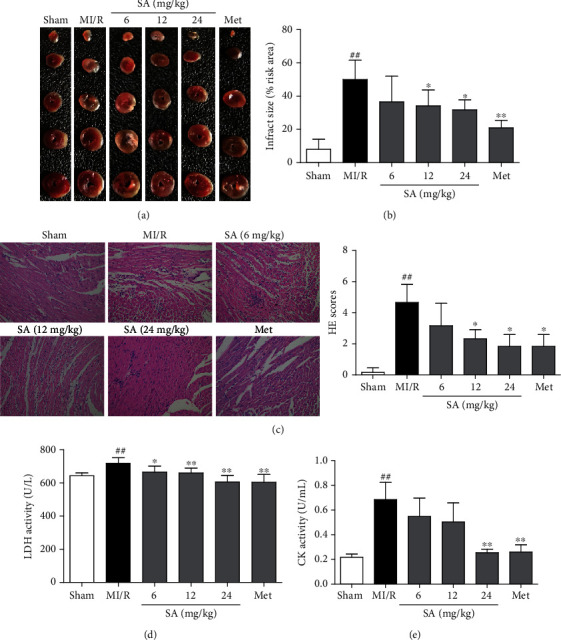
Figure 1.

SA attenuated myocardial injury in MI/R mice. (a) TTC staining of the myocardial infarct area. (b) Graphic representation of the myocardial infarct size. (c) Representative images of the myocardium measured by HE staining (200x magnification). (d) LDH activity. (e) CK activity. The data were expressed as the mean ± SD. ##P < 0.01 vs. sham group; ∗P < 0.05 and ∗∗P < 0.01 vs. MI/R group (n = 6).
