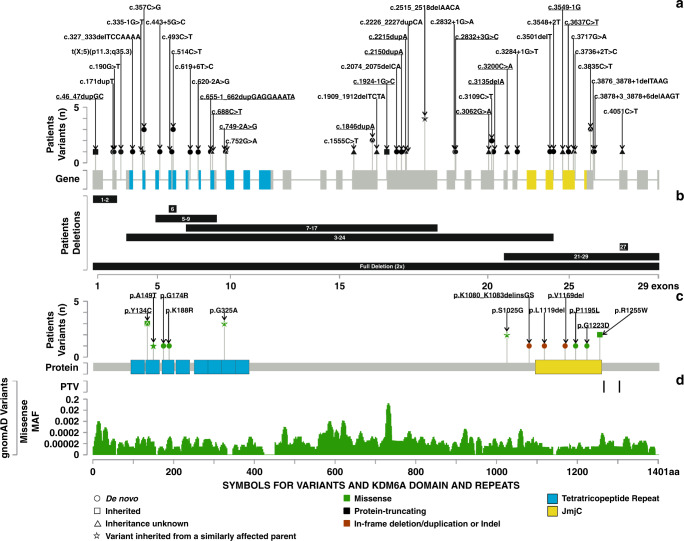
Fig. 1. Spectrum of pathogenic KDM6A variants.
(a) Protein-truncating variants (PTVs) described in this study. The x-axis shows the exon–intron locations and the y-axis shows the number of variants detected. Novel PTVs are underlined. (b) Deletions described in this study. The x-axis shows the exons affected. Novel deletions are underlined. (c) Protein-altering variants (PAVs) described in this study. The x-axis shows the protein location and the y-axis shows the number of variants detected. Novel PAVs are underlined. (d) Control variants seen in gnomAD, PTVs at the top and missense variants at the bottom. The x-axis shows the protein location and y-axis shows the minor allele frequencies of missense variants. MAF minor allele frequency.

