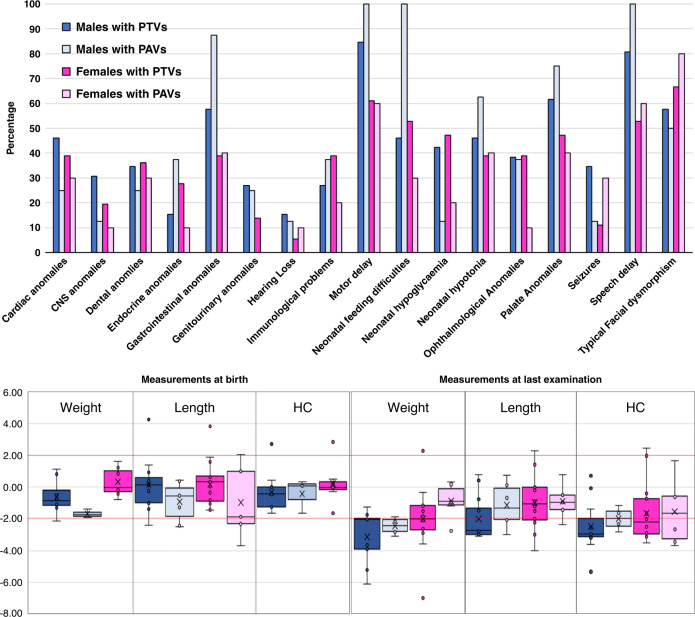
Fig. 3. Sex and variant type differences in type 2 Kabuki syndrome.
The upper panel shows the comparison of frequency of selected phenotypes between males and females with either PTVs or PAVs. Clinical features are arranged alphabetically from left to right. The lower panel shows the comparison of anthropometric data of patients at birth and at last examination. The y-axis denotes SD. Horizontal red lines depict +2 SD and −2 SD. Groups for which we had sparse data (female PAV birth weight and HC) have not been shown in these charts. CNS central nervous system, HC head circumference, PAV protein-altering variants (e.g., missense, in-frame indels), PTV protein-truncating variants (e.g., nonsense, frameshift, splice site).

