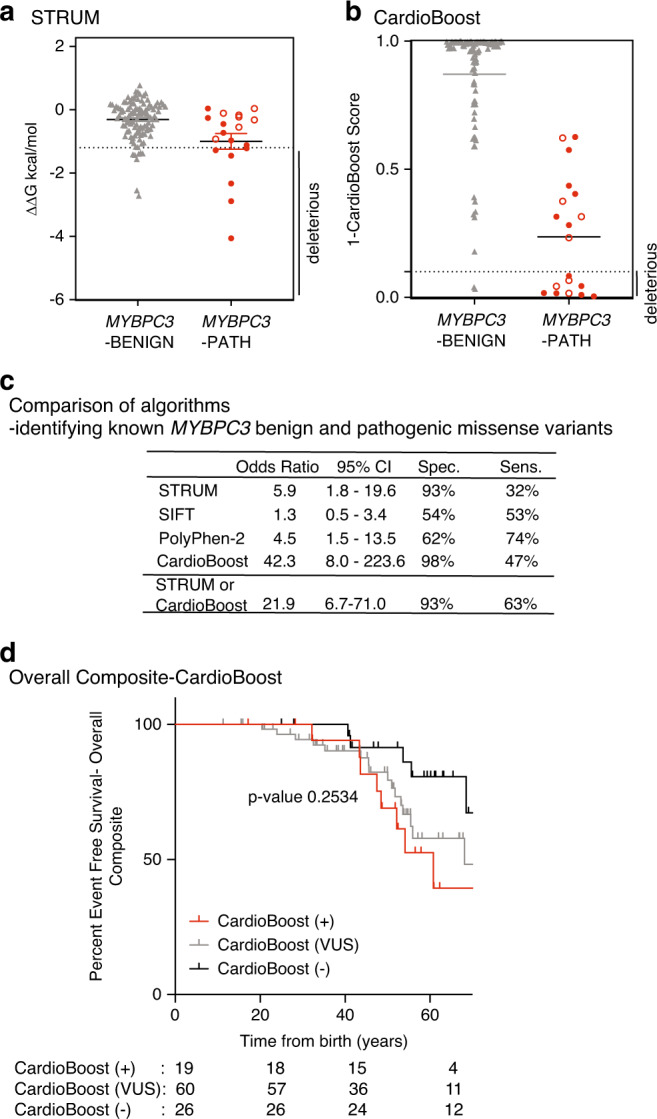
Fig. 3. STRUM is complementary to CardioBoost.

Results of computational analysis for each unique MYBPC3-Benign (gray triangles, n = 110) and MYBPC3-Path (red circles, n = 19) variant. (a) STRUM. (b) CardioBoost. Mean and SEM for each group depicted. The cutoff for deleterious variants for STRUM was ΔΔG ≤ −1.2 kcal/mol. The cutoff for deleterious variants for CardioBoost (CardioBoost +) was a probability score > 0.90; this is graphed as 1-CardioBoostScore < 0.10. C3 pathogenic variants are depicted in open circles in (a) and (b). (c) Statistical analysis of computational method utilized here in STRUM (Fig. 3), CardioBoost (Fig. 3), SIFT (Figure S6), and PolyPhen-2 (Figure S6) is shown including odds ratio, 95% confidence interval (CI), sensitivity, and specificity. (d) Using the same patient selection criteria in the Sarcomeric Human Cardiomyopathy Registry (SHaRe) detailed in Fig. 1, patients with hypertrophic cardiomyopathy (HCM) and a MYBPC3 missense variants of uncertain significance (VUS) were analyzed by CardioBoost. CardioBoost (+) was a probability score > 0.90, CardioBoost VUS ≥ 0.10 and ≤0.90, and CardioBoost (−) < 0.10. Of the 105 patients analyzed by STRUM 19 were CardioBoost (+). Kaplan–Meier curves reveal that patients carrying a CardioBoost (+) MYBPC3 VUS (red) exhibited higher rates of adverse HCM-related outcomes (overall composite) than patients carrying a CardioBoost (−) MYBPC3 VUS (black); however, the null hypothesis could not be excluded, p value 0.0945. This remains true when comparing patients carrying a MYBPC3 VUS that is CardioBoost (+) (red), CardioBoost (VUS) (gray), and CardioBoost (−) (black) (p value 0.2534).
