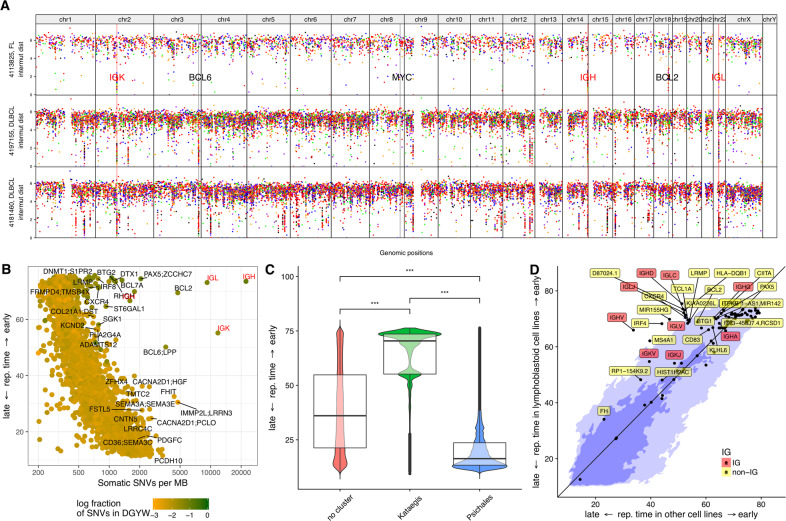
Fig. 1. Mutation density and replication timing.
A Rainfall plots of three samples including one FL (uppermost track) and two DLBCLs (second and third tracks from the top). For every track, the x-axis displays the genomic coordinate and the y-axis the log-scaled intermutation distance. Clusters of hypermutation (kataegis clusters) can be identified as “rainfalls” reaching very low intermutation distance. The IG loci are highlighted by red vertical lines and red labels, some hallmark genes involved in lymphomagenesis are highlighted by black vertical lines and black labels. B–D Correlation with replication timing. Replication timing is indicated as RepliSeq score of the respective genomic region as determined in [24] (see “Methods” for details). B Scatterplot of replication timing vs. mutation density, showing an inverse relationship between these two quantities. Outliers in this plot, i.e., exceptions from the inverse relationship, are typical targets of SHM in gcBCL. C Boxplot and violin plot of replication time vs. cluster category, demonstrating that kataegis is significantly enriched in early replicating regions (p < 10−16) and psichales in late replicating regions (p < 10−16) of the genome. D Rewiring of replication timing: kataegis regions are located in regions of the genome which are earlier replicating in lymphoblastoid cell lines (y-axis) than in other cell lines (HeLa-S3 (cervical adenocarcinoma), HUVEC (umbilical vein endothelial cells), K562 (chronic myelogenous leukemia in blast crisis), NHEK (epidermal keratinocytes), MCF-7 (mammary gland, adenocarcinoma), IMR-90 (fetal lung fibroblasts), and HepG2 (hepatocellular carcinoma) (x-axis). The light blue color in the background indicates the 95% quantile, the dark blue one the 68% quantile (respective fractions of all SNVs are situated on the colored areas). Regions with a difference in RepliSeq score > 3 are annotated by the closest gene.

