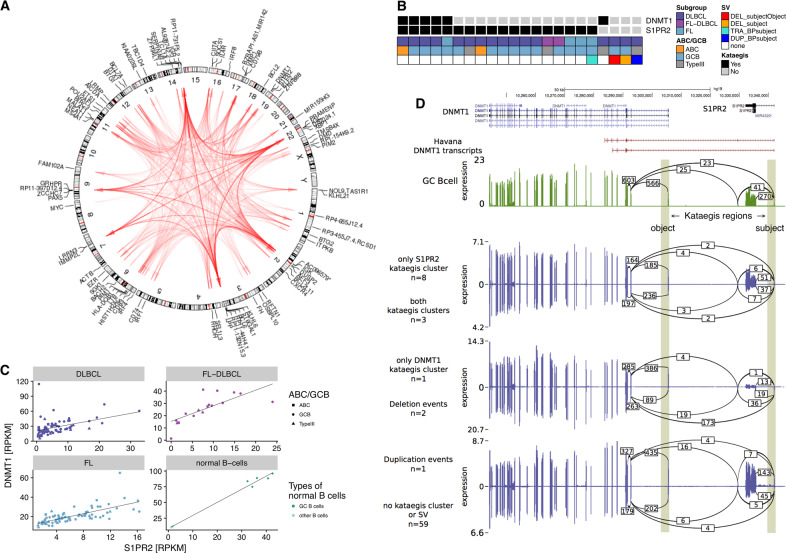
Fig. 3. Hypermutation by proxy (HbP).
A Genome-wide circos diagram showing the positions of all kataegis clusters and their co-occurrence by red arcs. The transparency of these arcs encodes the recurrency of co-occurrence. Arcs are directed from the subject (i.e., primary target) to the object (i.e., secondary target) of the HbP relationship. B–D Detailed illustration of the HbP relationship between S1PR2 and DNMT1. B Co-occurrence: black squares indicate in which samples kataegis clusters are present. Annotation data shows which subgroup the samples belong to, which cell of origin they have and whether a SV is present (DEL_subjectObject: deletion involving both subject (in this case S1PR2) and object (in this case DNMT1); DEL_subject: deletion involving only the subject; TRA_BPsubject: translocation with breakpoint in the subject; DUP_BPsubject: duplication with breakpoint in the subject). C Co-expression in the different subgroups (and normal B cells, other B cells standing for naïve B cells) and D tandem RNA chimeras as detected from RNA-seq: tracks displaying from top to bottom: i) known transcripts of S1PR2 and DNMT1; and Sashimi plots for transcriptomic data of ii) normal GC B cells; iii) lymphoma samples with only S1PR2, i.e., the subject, affected by kataegis; iv) lymphoma samples with both S1PR2 and DNMT1, i.e., subject and object, affected by kataegis; v) lymphoma samples with only DNMT1, i.e., the object, affected by kataegis; vi) lymphoma samples with a deletion affecting either kataegis regions; vii) lymphoma samples with a duplication affecting either kataegis region; and viii) lymphoma samples affected by no event at all in this genomic region. Vertical shading highlights the genomic positions of the two kataegis regions. Numbers on arcs in the sashimi plots display the mean number of splice events (spliced reads) found in the corresponding group.

