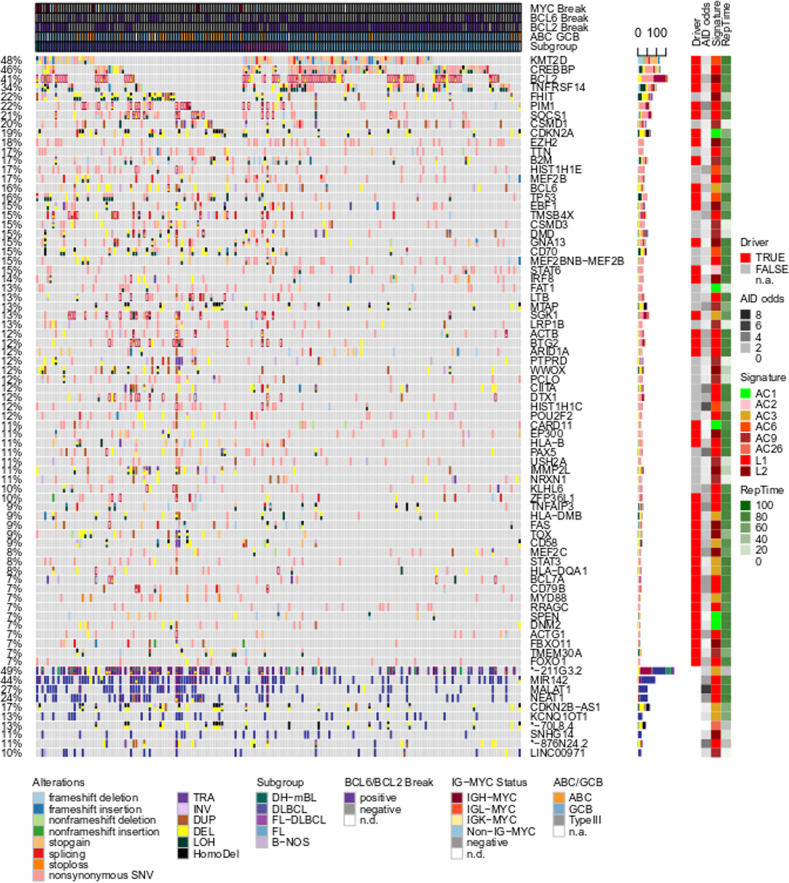
Fig. 5. B cell-specific mutagenesis alone is not sufficient to drive lymphomagenesis.
Oncoprint of coding (upper part of the figure) and noncoding (lower fifth of the figure dominated by blue color) mutations. The x-coordinate encodes samples which are pre-sorted by subgroups. The y-coordinate encodes different genes or non-coding genes. Different mutation types are encoded by the fill color of the fields in the oncoprint, where different types of mutation can coexist in one sample. Four layers of annotation on the right side of the oncoprint display (i) whether a gene is identified as a driver and (ii) how strongly mutations in AID-specific motifs are enriched, (iii) the best matching signature, and (iv) replication timing.

