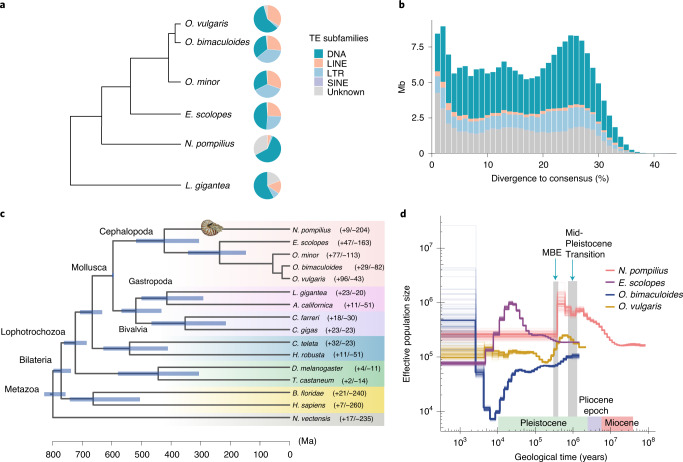
Fig. 1. Genomic structure of the N. pompilius genome and cephalopod phylogeny.
a, Proportions of DNA transposons, LTR, LINE and SINE retrotransposons in the genomes of five representative cephalopods including N. pompilius, E. scolopes, O. bimaculoides, O. minor and O. vulgaris. The tree delineates the evolutionary relationships among the five cephalopod species. The pie charts are scaled according to genome size (Supplementary Fig. 2). b, History of TE accumulation in the N. pompilius genome. c, A phylogenetic tree was constructed with 423 orthologues from 16 metazoan animals using OrthoMCL with a Markov cluster algorithm. Divergence time was estimated with the approximate likelihood calculation method in conjunction with a molecular clock model. A bar within a branch indicates the 95% confidence interval of divergent time. The positive and negative numbers adjacent to the taxon names are gene family numbers of expansion/contraction obtained from the CAFE analysis. d, Demographic history of cephalopods. Historical effective population size (Ne) was estimated by using the PSMC method. The synonymous mutation rate per base per year in N. pompilius was inferred based on the formula T = ks/(2λ), with a generation time of 15 years. The synonymous mutation rate of N. pompilius was estimated as 2.77 × 10⁻⁹ and that of other cephalopods as 4.07 × 10⁻⁹. Estimation was performed with 100 bootstraps. Pivotal turning points in environmental evolution during the last million years are labelled with blue arrows.

