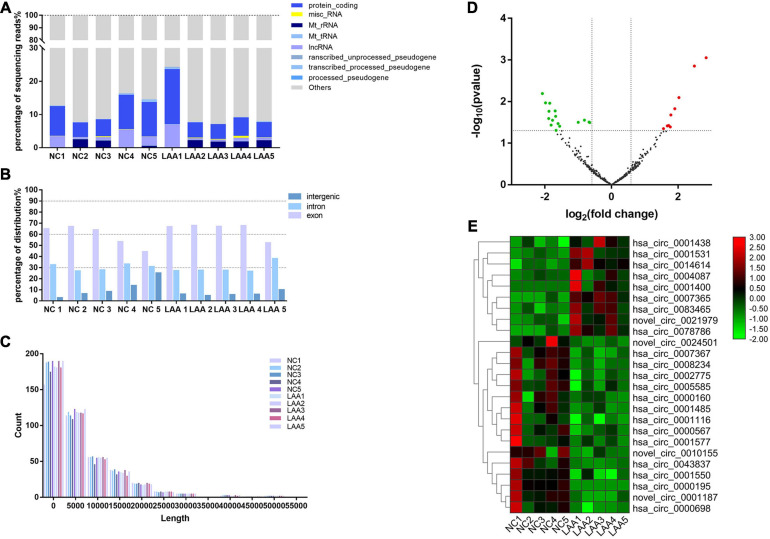
FIGURE 2.
Expression profiles of exosome-circRNAs from RNA-Seq. (A) Various RNA biotypes expressed as a percentage of the total sequencing reads by taking the average reads of each biotype across each group. (B) circRNAs from exons, introns, or intergenic regions. (C) The lengths of circRNAs in each subject. (D) Volcano plots of differentially expressed circRNAs. The red and green dots indicate upregulated and downregulated circRNAs, respectively. (E) Heat maps of differentially expressed circRNAs.

