FIGURE 3.
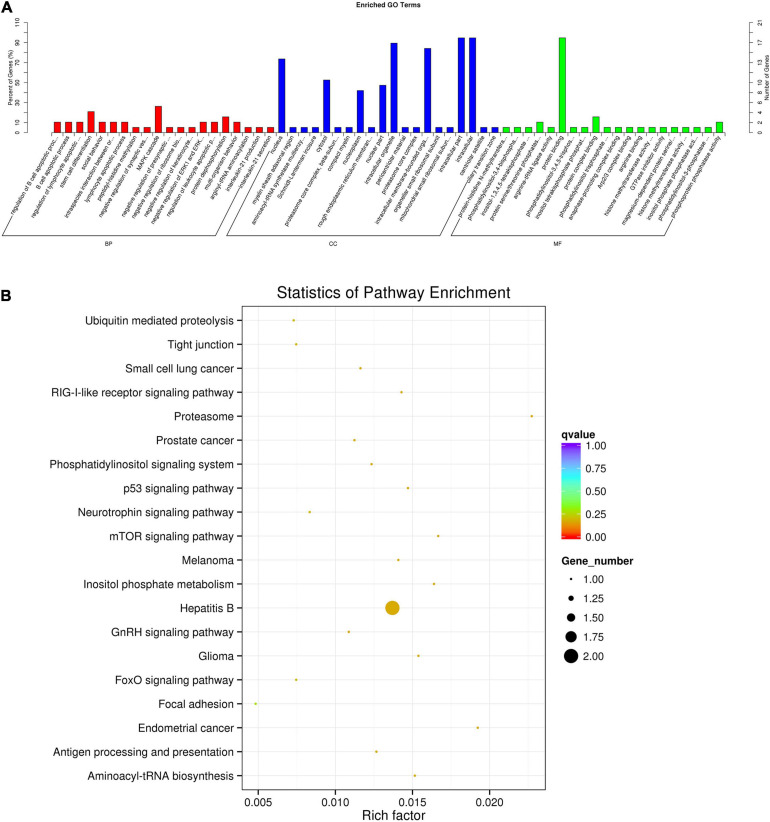
Functional enrichment of the source genes of the DE circRNAs. (A) Top 20 biological processes, cell components, and molecular functions according to GO analysis. (B) Top 20 pathways according to KEGG analysis visualized on a bulb map. The color of the dot corresponds to different p-value ranges, and the size of the dot indicates the number of genes in the pathway.

