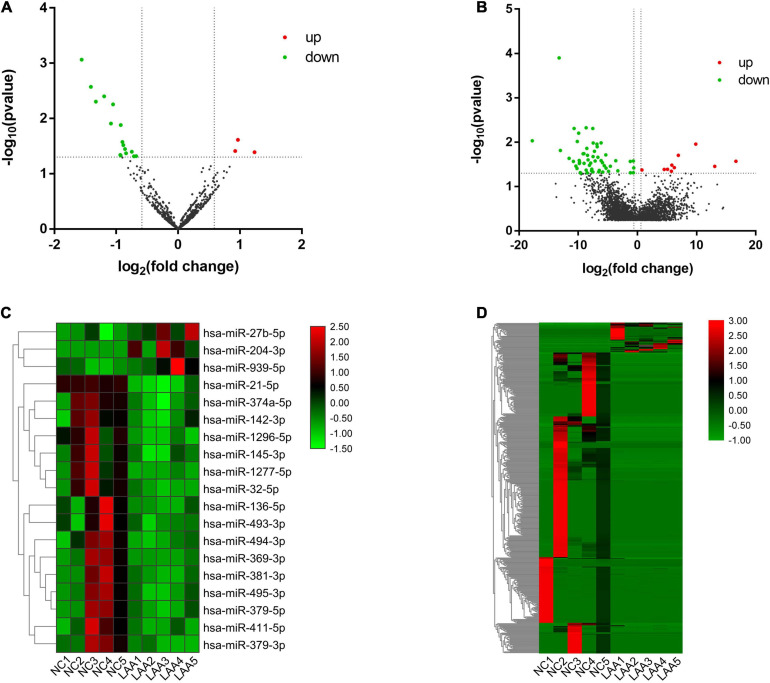
FIGURE 4.
Differential expression and hierarchical cluster analysis of miRNAs, and mRNAs. Volcano plots of significantly differentially expressed RNAs. The red and green dots indicate upregulated and downregulated genes, respectively. The horizontal dotted lines represent a p-value of 0.05, and the vertical dotted lines represent a fold change of 1.5-fold. Heat maps of the RNA expression hierarchical patterns. (A,B) Volcano plots of differentially expressed miRNAs, mRNAs. (C,D) Heat maps of differentially expressed miRNAs, mRNAs.

