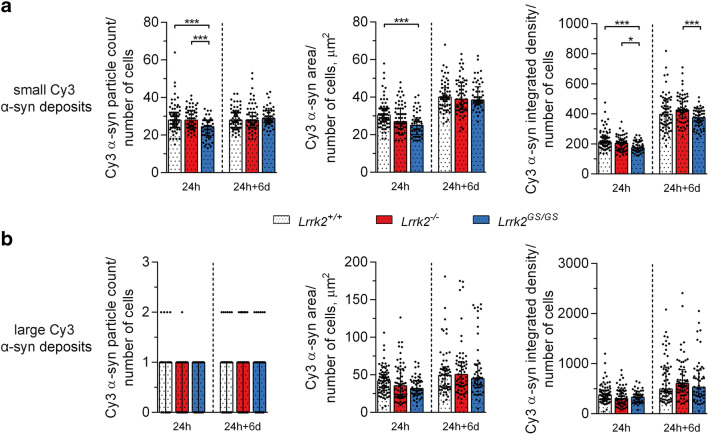
Fig. 2.
Analysis of the differently sized α-syn inclusions in Lrrk2 astrocytes. A, B Analysis of small and large Cy3 α-syn inclusions, respectively. Quantifications of Cy3 α-syn particle count, total area, and integrated density were performed using ImageJ. For both time points, ten images per independent cell culture (24 h: Lrrk1+/+, n = 7; Lrrk2−/−, n = 6; and Lrrk2GS/GS, n = 5; 24 h + 6 d: Lrrk1+/+, n = 6; Lrrk2−/−, n = 6; and Lrrk2GS/GS, n = 5) were analyzed and reported. For each time point, the statistical analysis was performed with the Kruskal-Wallis test followed by Dunn’s multiple comparisons test, since the data did not follow Gaussian distribution for all groups. *p ≤ 0.05, **p ≤ 0.01, ***p ≤ 0.001

