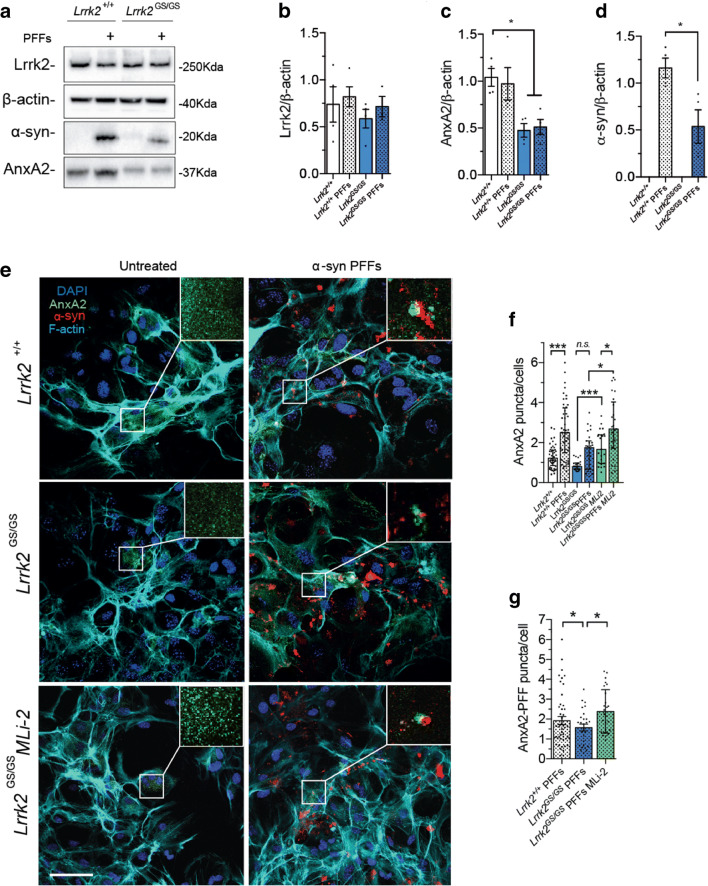
Fig. 7.
Analysis of AnxA2 function in G2019S primary striatal astrocytes at endogenous level. A Western blot analysis of primary striatal astrocyte lysates under PFF-treated and basal conditions using anti-Lrrk2, anti-α-syn, and anti-AnxA2 antibodies. B, C, D Quantification of band intensity was performed using ImageJ and normalized by β-actin (n = 4). E Representative images of Lrrk2+/+ and Lrrk2GS/GS astrocytes treated or not with α-syn PFFs and stained with anti-AnxA2 (green), anti-α-syn (red), F-actin (cyano), and cell nuclei with DAPI (blue). MLi-2-treated Lrrk2GS/GS astrocytes are shown in the bottom panels. Scale bar 20 μm. Insets show a close-up of α-syn inclusions and re-localized AnxA2. F, G Eight images per cell culture were analyzed (n = 3). Quantifications of Anxa2 puncta and AnxA2-α-syn PFFs proximity were performed using ImageJ. Statistical analysis in F and G was made by Kruskal-Wallis test followed by Dunn’s multiple comparisons test. Statistical analysis in B, C, and D was performed with unpaired t test or one-way ANOVA followed by Tukey’s multiple comparisons test. *p ≤ 0.05, **p ≤ 0.01, ***p ≤ 0.001

