Fig. 2.
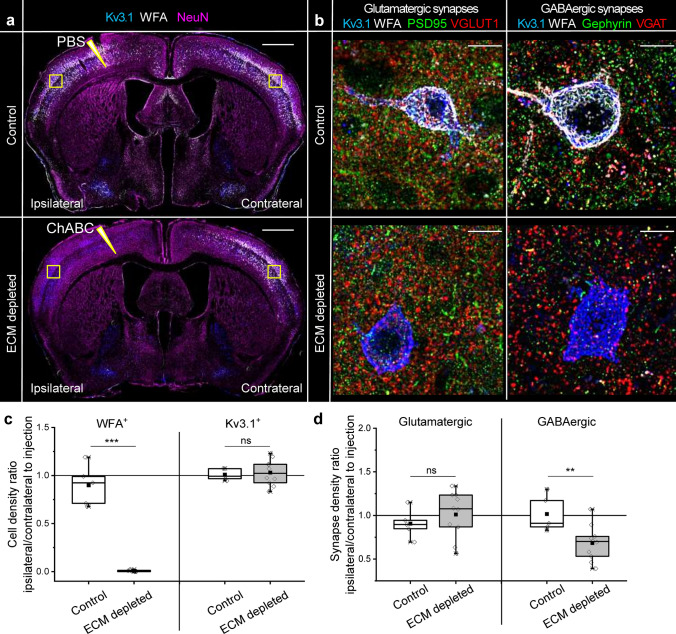
Inhibitory synapse density decreases after ECM depletion in vivo. a Neuronal nuclei (NeuN, magenta), fast spiking interneurons (Kv3.1, blue) and PNNs (WFA, Wisteria floribunda agglutinin, white) were immunohistochemically labeled in brain sections obtained from mice treated with chondroitinase ABC (ChABC, ECM depleted) or phosphate buffered saline (PBS, control) for 16 h. Sharp triangles indicate intracortical injection sites. Squares indicate the regions in which cell and synapse densities were analyzed. Scale bar, 1 mm. b The density of glutamatergic (PSD95-VGLUT1) and GABAergic (gephyrin-VGAT) synapses was measured in somatosensory cortex layers 3–5. Maximum projections of 56.7 × 56.7x5 μm regions ipsilateral to the injection sites are shown. Scale bars, 10 µm. c Changes in PNN+ and Kv3.1+ neuron densities were quantified as ipsilateral to contralateral ratios. d Changes in glutamatergic and GABAergic synapse densities were calculated as ipsilateral to contralateral ratios. Data are shown for each animal examined (n ≥ 5 animals per condition). Data are medians (lines inside boxes)/ means (filled squares inside boxes) ± interquartile ranges (IQR; boxes) with 10/ 90% ranks as whiskers. Open diamonds are data points. The asterisks indicate significant differences with control, based on Kruskal–Wallis tests (***p < 0.001, **p < 0.01). ns not significant

