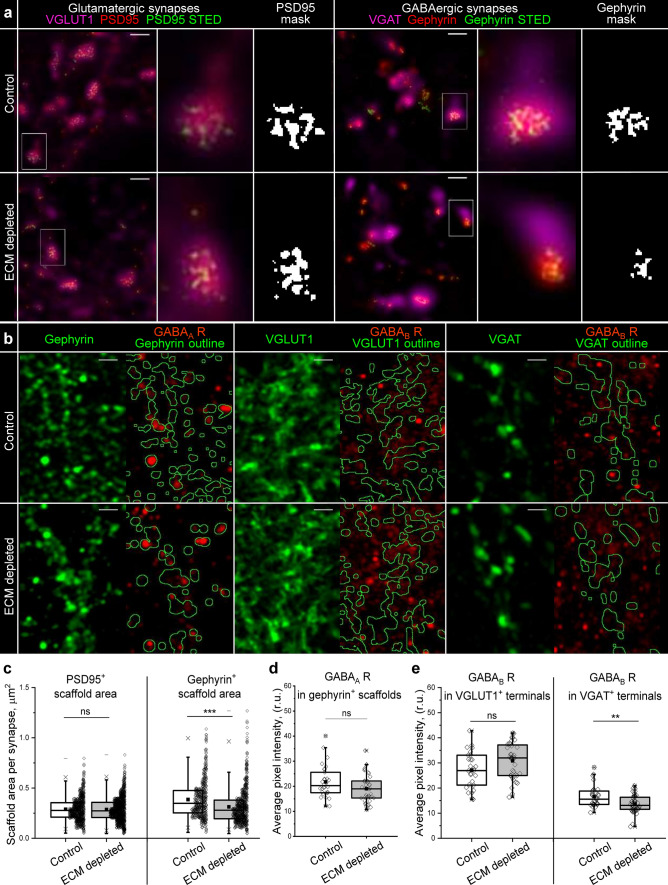
Fig. 4.
ECM depletion alters the pre- and postsynaptic organization of inhibitory synapses. a Stimulated emission depletion (STED) microscopy resolves the morphology of presynaptic scaffolds in glutamatergic and GABAergic synapses. Scale bars, 1 μm. Single synapses highlighted with white rectangles are magnified and the corresponding masks of postsynaptic scaffolds are shown. b The panel illustrates the analysis of GABAA receptor (GABAA R) expression in inhibitory postsynapses (gephyrin+ areas), GABAB receptor (GABAB R) expression in excitatory (VGLUT1+ areas) and inhibitory (VGAT+ areas) postsynapses. The outlined areas (green) depict the regions in which the immunoreactivity of GABA receptors was measured. Scale bars, 2 μm. c The area of scaffolds containing PSD95 or gephyrin was quantified in single synapses (n ≥ 580 synapses per condition, results from 5 independent experiments). d Immunoreactivity of GABAA receptors in GABAergic postsynapses. e Immunoreactivity of GABAB receptors in glutamatergic and GABAergic presynapses. d, e The average pixel intensity was quantified for each neuron examined (n ≥ 30 cells per condition, results from 5 independent experiments). Data are medians (lines inside boxes)/ means (filled squares inside boxes) ± IQR (boxes) with 10/ 90% ranks as whiskers. Open diamonds are data points. The asterisks indicate significant differences with control, based on Kruskal–Wallis tests (***p < 0.001, **p < 0.01). ns, not significant

