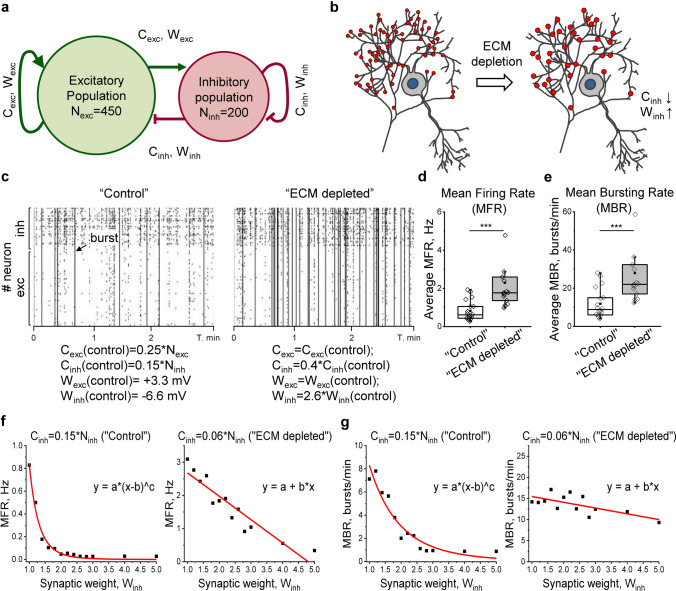
Fig. 6.
Network activity simulation in silico indicates the prevailing role of inhibitory connectivity reduction following ECM depletion. a The schematic drawing illustrates the model of the spiking neuron network. Ninh and Nexc are numbers of inhibitory and excitatory neurons, Winh and Wexc are weights of corresponding synapses. b The ECM depletion was mimicked by tuning Cinh and Winh parameters in accordance with experimentally observed changes. c Raster plots exemplify the activity of “control” and “ECM depleted” networks. The corresponding simulation parameters are depicted. Ticks are single spikes, vertical dashes indicate burst events. The quantification of network average (d) mean firing rate (MFR) and (e) mean bursting rate (MBR) is shown for “control” and “ECM depleted” simulation conditions. Data are medians (lines inside boxes)/ means (filled squares inside boxes) ± IQR (boxes) with 10/ 90% ranks as whiskers. Open diamonds are data points. The asterisks indicate significant differences with the control, based on Kruskal–Wallis tests (***p < 0.001). (f) MFR and (g) MBR are quantified in a range of Winh changes for “control” and “ECM depleted” inhibitory connectivity. Note that the reduction of inhibitory connectivity switches the dependence of network activity on inhibitory synapse weight from power law to linearity. Squares indicate the mean of simulation repetitions, fit functions are shown in red. For each condition, 15 independent simulation experiments were performed

