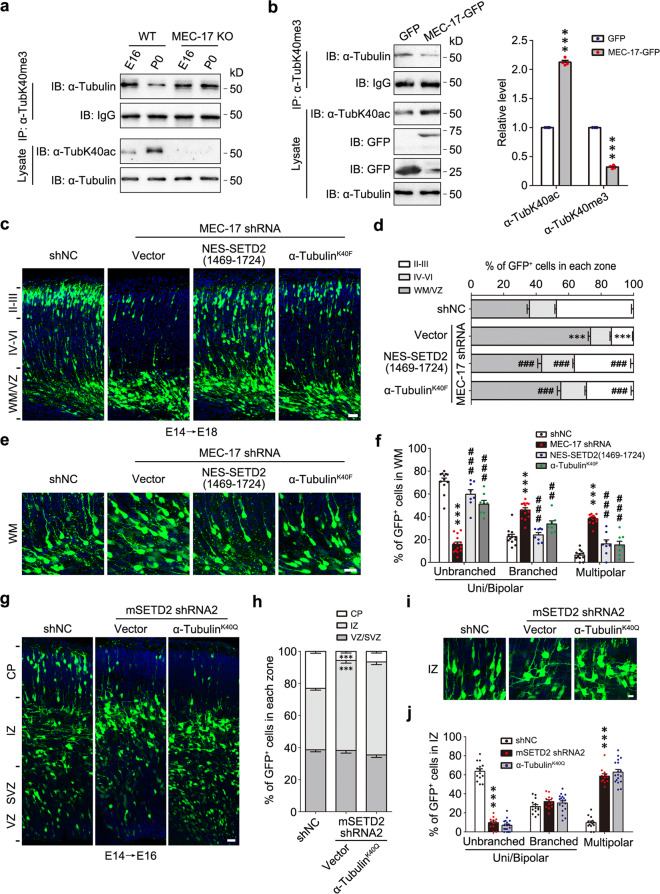
Fig. 6. α-TubK40me3 is increased after MEC-17 knockout and able to rescue the defects of α-TubK40ac-deficient neurons.
a Immunoprecipitation by α-TubK40me3 antibody and following immunoblotting with α-tubulin showed that the level of α-TubK40me3 was not decreased at P0 in the cerebral cortex of MEC-17 knockout mice (n = 3 biological replicates). b Immunoprecipitation and quantitative analysis showed that the level of α-TubK40me3 was significantly reduced after overexpression of MEC-17 in HEK293 cells. All data were shown as the mean ± s.e.m. (n = 4 biological replicates). Data were analyzed using paired two-tailed Student’s t test. ***P < 0.001 versus GFP. c Representative images of coronal brain sections in somatosensory cortex at E18 showed the distribution of GFP+ cells (green) electroporated with GFP reporter as well as shNC, MEC-17 shRNA or MEC-17 shRNA together with NES-SETD2(1469-1724) or α-tubulinK40F at E14. Sections were stained for DAPI (blue). Scale bar: 30 μm. d Quantitative analysis of c showed that the migration defects induced by MEC-17 knockdown was highly rescued by expressing either NES-SETD2(1469-1724) or α-tubulinK40F. All data were shown as the mean ± s.e.m. (n = 18, 22, 18, 14, respectively). Data were analyzed using two-way ANOVA with Bonferroni’s post-hoc test. ***P < 0.001 versus shNC; ###P < 0.001 versus MEC-17 shRNA. e Representative images of GFP+ neurons (green) in white matter (WM). Brain slices were stained for DAPI (blue). Scale bar: 20 μm. f Quantitative analysis of e showed that the percentage of GFP+ neurons at the multipolar and branched uni/bipolar stage was largely rescued by expressing either NES-SETD2(1469-1724) or α-tubulinK40F. All data were shown as the mean ± s.e.m. (n = 12, 14, 8, 8, respectively). Data were analyzed using two-way ANOVA with Bonferroni’s post-hoc test. ***P < 0.001 versus shNC; ##P < 0.01, ###P < 0.001 versus MEC-17 shRNA. g Representative images of coronal brain sections in somatosensory cortex at E16 showed the distribution of GFP+ cells (green) electroporated with GFP reporter as well as shNC, mSETD2 shRNA2 or mSETD2 shRNA2 together with Flag-α-tubulinK40Q at E14. Sections were stained for DAPI (blue). Scale bar: 25 μm. h Quantitative analysis of g showed that the migration defects induced by SETD2 knockdown was not rescued by expressing α-tubulinK40Q. All data were shown as the mean ± s.e.m. (n = 16, 12, 18, respectively). Data were analyzed using two-way ANOVA with Bonferroni’s post-hoc test. ***P < 0.001 versus shNC. i Representative images of GFP+ neurons (green) in IZ. Brain slices were stained for DAPI (blue). Scale bar: 10 μm. j Quantitative analysis of i showed that the percentage of GFP+ neurons at the multipolar stage was not rescued by expressing α-tubulinK40Q. All data were shown as the mean ± s.e.m. (n = 14, 12, 18, respectively). Data were analyzed using two-way ANOVA with Bonferroni’s post-hoc test. ***P < 0.001 versus shNC. Source data are provided as a Source Data file.

