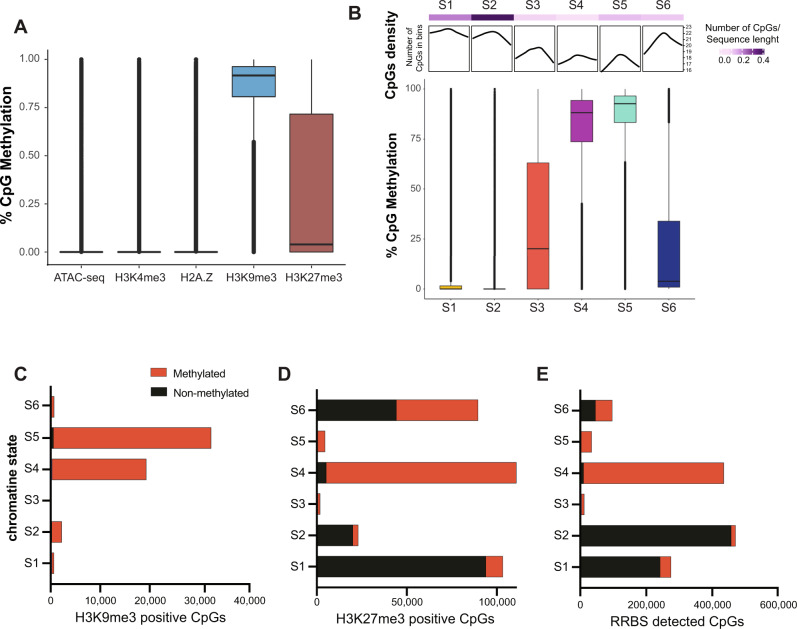
Fig. 2. DNA methylation is enriched in repressive chromatin states and excluded from promoters.
A Methylation levels of individual CpGs in the regions designated as occupied by peaks from ATACseq and ChIPseq. The line in the boxplot represents the median of the distribution and boundaries of the boxes as the quartiles and the whiskers mark the 10th and 90th percentiles. B The CpG methylation status in each chromatin state is correlated with CpG density. The top panels display CpG density and the box and whisker plots display the range of CpG methylation across each state based on RRBS. The line in the boxplot represents the median and the boxes represent first and third quartiles, the whiskers represent data that are within the 1.5 × interquartile range; data beyond the end of the whiskers are outlying points that are plotted individually. C–E. Black indicates methylated, red indicates unmethylated. The number of CpGs categorized as methylated (>80%) and nonmethylated (<20%) plotted across (C) the entirety of each chromatin state or in the regions of each state occupied by H3K9me3 (D) or H3K27me3 (E).

