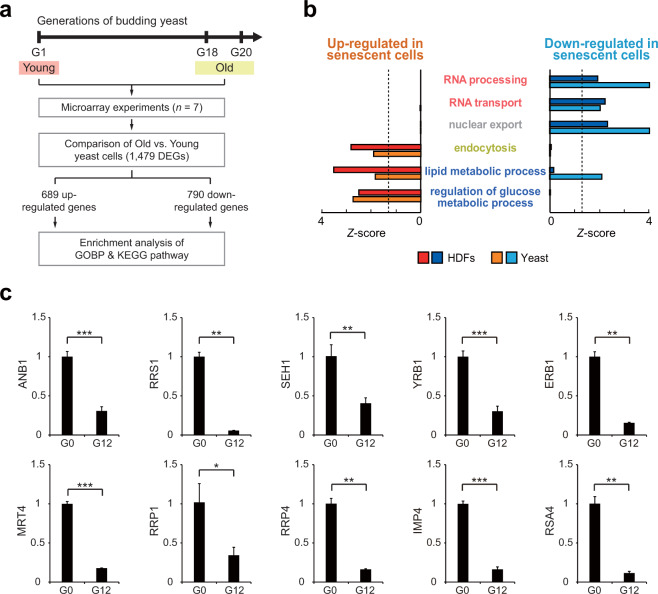
Fig. 4. Disruption of NCT is conserved in aging yeast.
a Schematic overview of the experimental design and microarray and data analyses. The number of DEGs between young and old yeast cells is presented. b Cellular processes (GOBPs) significantly (P < 0.1) enriched consistently by upregulated (red) or downregulated (blue) genes in aged yeast cells and HDFs undergoing RS. The Z-score indicates –N−1(P), where P is the enrichment P value determined with DAVID software and N−1(·) is the inverse normal distribution. c qRT-PCR analysis of representative genes involved in common NBIS-RS cellular pathways in the replicative aging yeast model. For the replicative aging model, the analysis was performed at 0 generations (young) and 12 generations (old). mRNA expression levels were first normalized to those of CDC19 (internal control) and then further normalized by the mean mRNA expression level in young yeast cells. In this analysis, two additional non-DEGs, SEH1 and YRB1, with P values close to the cutoff value, were included to confirm the downregulation of NCT. The values are presented as the means ± SD (n = 2 or 3). *, P < 0.05; **, P < 0.01; and ***, P < 0.001 by Student’s t-test.

