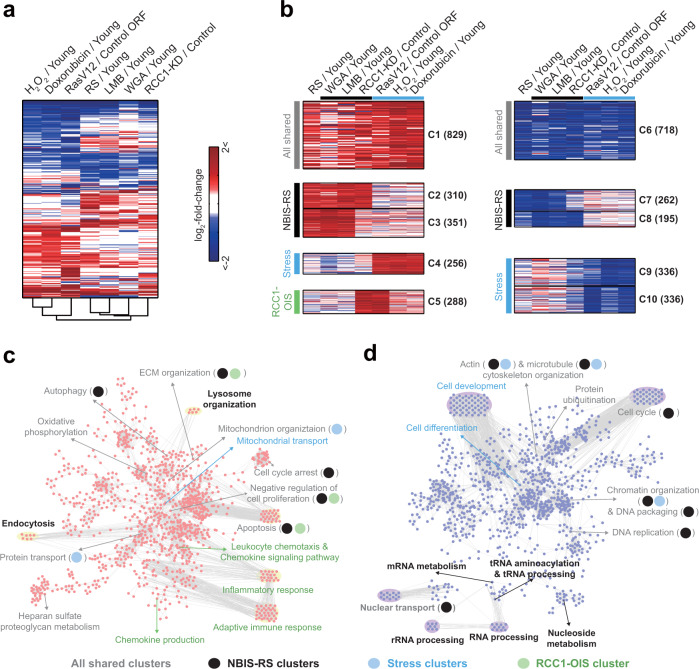
Fig. 5. The senescence-associated changes in NBIS are most similar to those in RS.
a Hierarchical clustering of seven cellular senescence models (RS-, WGA- and LMB-treated HDFs, RCC1-knockdown HDFs, OIS, OSIS, and DDIS) based on DEGs in at least one of the seven models (as determined by Euclidean distance and average linkage method). Colors represent the increase (red) and the decrease (blue) in mRNA expression levels for each senescence model with respect to its corresponding control. The color bar denotes the gradient of log2-fold-change between each senescence model and its corresponding control. b Top 10 clusters of DEGs identified by NMF clustering analysis based on their differential expression patterns across the seven cellular senescence models. The color scheme is the same as that shown in (a). c, d Process network models constructed for upregulated genes in C1-5 (c) and downregulated genes in C6-10 (d) using cellular process association analysis. Magenta and purple nodes represent GOBPs/KEGG pathways significantly (P < 0.1) enriched with genes in at least one of the upregulated (C1-5) and downregulated clusters (C6-10). Edges represent significant genes overlap between the connected GOBPs/KEGG pathways. Label colors or circle colors indicate that the corresponding GOBPs/KEGG pathways are enriched by the genes in the corresponding clusters (see legend at the bottom of the figures). Circles are used only for a GOBP/KEGG pathway enriched by two or more types of clusters, including ‘All shared clusters’.

