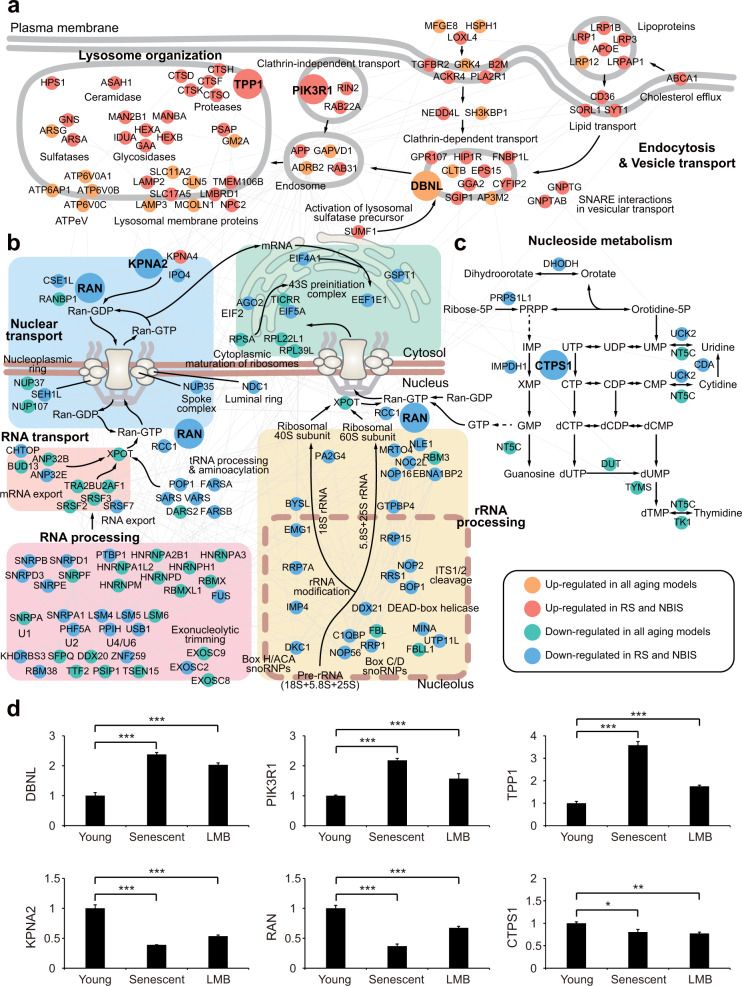
Fig. 6. Processes common to NBIS and RS coordinate the reduction of NCT.
a–c Network models showing interactions among DEGs involved in endocytosis and lysosomal degradation (a), nuclear transport and RNA processing (b), or nucleotide metabolism (c). Node colors represent the clusters to which the corresponding belong (see legend box). Gray lines denote protein-protein interactions, arrows represent the transport of molecules or metabolic reactions, the dotted line denotes the membrane of the nucleolus, and the two thick lines represent the plasma or nuclear membrane. Names of complexes or functional modules for the closely located genes are shown. d qRT-PCR analysis of representative genes in the cellular pathways common to both NBIS and RS. The analyzed genes are shown as large nodes in the network models (a–c). mRNA expression changes were first normalized to those of RPS11 (internal control) and then further normalized by the mean mRNA expression change in young HDFs. The values are presented as the means ± SD (n = 2 or 3). *, P < 0.05; **, P < 0.01; and ***, P < 0.001 by one-way analysis of variance with Dunnett’s post hoc test.

