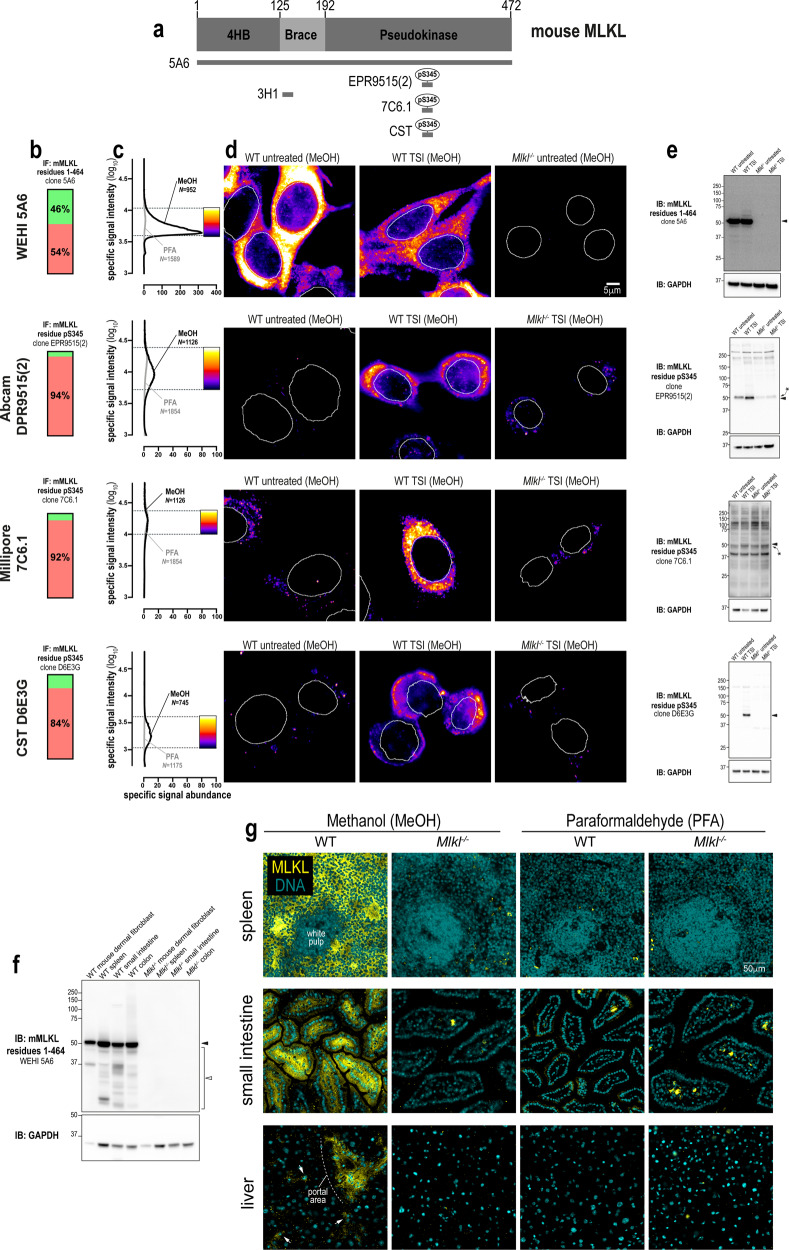
Fig. 4. A new monoclonal antibody to image endogenous mouse MLKL.
a Mouse MLKL domain architecture showing the immunogens or epitopes for the tested anti-MLKL antibodies. b Quantitation of the percentage of gated signals for the tested MLKL antibodies. c Quantitation of specific signal abundance produced by the tested MLKL antibodies on methanol-fixed (MeOH) or paraformaldehyde-fixed (PFA) MDFs. The number of cells imaged (N) to generate each signal-to-noise curve is shown. d Micrographs of immunofluorescent signals for the tested MLKL antibodies on MDFs. As indicated by each pseudocolour look-up-table, only immunosignals within the respective gate in panel c were visualised. Data are representative of n = 3 (in-house clone 5A6) and n = 2 (Abcam clone EPR9515(2), Millipore MABC1158/clone 7C6.1 and Cell Signaling Technology clone D6E3G) independent experiments. Nuclei were detected by Hoechst 33342 staining and are demarked by white outlines in micrographs. Immunoblot using the tested MLKL antibodies against lysates from wild-type versus Mlkl−/− MDFs (e) and from lysates of wild-type versus Mlkl−/− mouse spleen, small intestine and colon (f). Closed arrowheads indicate the main specific band. Asterisks indicate non-specific bands that could otherwise confound data interpretation. Open arrowheads indicate other specific bands of interest. Immunoblots were re-probed for GAPDH as loading control. g Micrographs of clone 5A6 immunosignals on methanol- or paraformaldehyde-fixed sections of the wild-type versus Mlkl−/− mouse spleen, small intestine and liver. Data are representative of n = 2 mice per genotype. In the spleen, MLKL expression was noted in the red pulp, but not the white pulp. In the small intestine, MLKL expression was observed both in epithelial cells and subepithelial cell types in villi. In comparison, MLKL expression was more restricted in the liver; being primarily observed in perivascular regions such as the portal area and in parenchymal cells that resemble Kupffer cells (exemplified by arrows).

