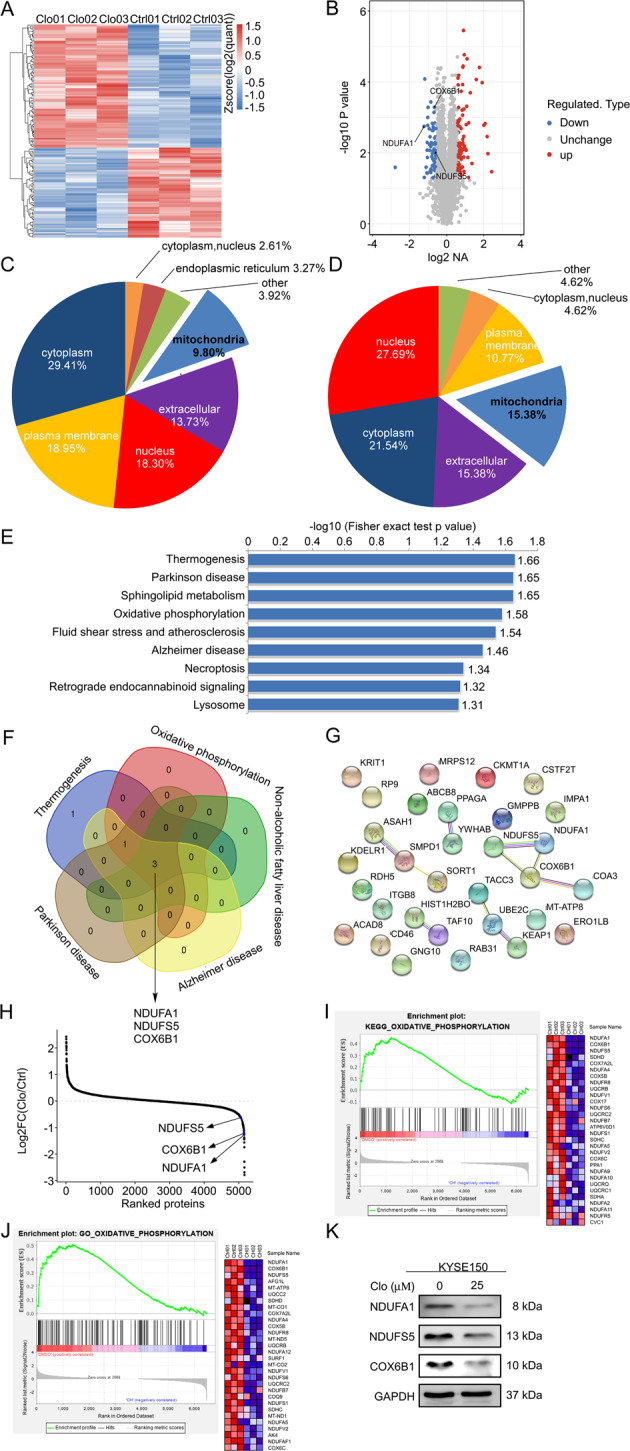
Fig. 2. Cloperastine suppresses NADH dehydrogenase (ubiquinone) 1 alpha subcomplex 1 (NDUFA1), NADH ubiquinone oxidoreductase subunit S5 (NDUFS5), and cytochrome C oxidase subunit 6B1 (COX6B1) expression.

A The heat map represents the differentially expressed protein in KYSE150 cells treated with DMSO or cloperastine for 24 h. B Volcano map shows 89 up-regulated proteins and 65 down-regulated proteins, and the positions of NDUFA1, NDUFS5, and COX6B1 are marked. C WoLF PSORT software analysis of the subcellular structure localization and classification analysis of differentially expressed proteins. D WoLF PSORT software analysis of the subcellular structure localization and classification analysis of down-regulated proteins. E Down-regulated KEGG pathways enrichment. Data were shown as −Log10 (Fisher’s exact test p-value). F Venn diagram shows a set of down-regulated five pathways and lists three down-regulated proteins, and NDUFA1, NDUFS5, and COX6B1 are marked. G Diagram of protein-protein interaction network of down-regulated proteins, and NDUFA1, NDUFS5, and COX6B1 are located. H The average quantitative kinase data is ranked according to its Log2 FC between the cells after DMSO and cloperastine, and shows the positions of NDUFA1, NDUFS5, and COX6B1. I GSEA analysis of the changes in oxidative phosphorylation of the KEGG gene set after DMSO and cloperastine treatment. J GSEA analysis of the changes in oxidative phosphorylation of the GO gene set after DMSO and cloperastine treatment. K Western blotting for NDUFA1, NDUFS5, and COX6B1 in KYSE150 cells after DMSO and cloperastine treatment.
