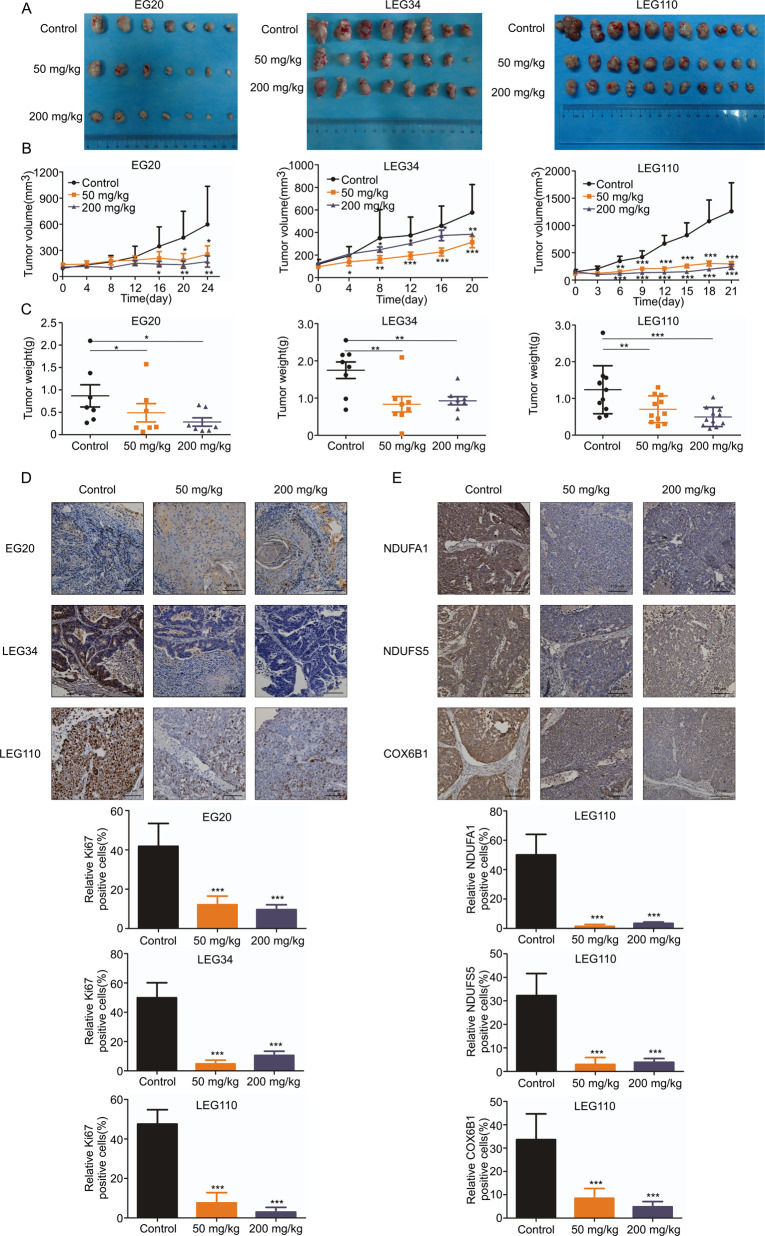
Fig. 6. Cloperastine inhibits patient-derived xenograft (PDX) tumor growth in vivo.
A–C Effect of cloperastine on ESCC tumor growth. Cloperastine significantly suppressed tumor growth of case EG20 (7 mice/group), LEG34 (8 mice/group) and LEG110 (11 mice/group). The tumor volume was measured every 3–5 days. (*p < 0.05, **p < 0.01, ***p < 0.001). D Immunohistochemical analysis the level of Ki67 in case EG20, LEG34, and LEG110 tumor tissues. The number of Ki67-stained cells was counted in down panel. (*p < 0.05, **p < 0.01, ***p < 0.001) (E) Immunohistochemical analysis (IHC) NDUFA1, NDUFS5, and COX6B1 protein levels in case LEG110 tumor tissues. The number of NDUFA1, NDUFS5, and COX6B1 stained cells was counted in down panel. (*p < 0.05, **p < 0.01, ***p < 0.001)Supplement Fig. 1 Screening drug from FDA-approved drug library. A Cytotoxicity of FDA-approved drugs on KYSE450 cells. Cells were treated with FDA-approved drugs at 50 μM and then measured cell viability at 48 h.Supplement Fig. 2 Mass spectrometry analysis based on proteome. A Flowchart for identification of quantitative proteomics. Control group treated with DMSO and the Treated group treated with cloperastine (25 μM) for 24 h in KYSE150 cells. B Peptide mass error. C The length distribution of peptides. D GSEA analysis of the changes in mitochondria respiratory electron transport of the KEGG gene set and in mitochondria aerobic electron transport chain of the GO gene set after DMSO and cloperastine treatment.Supplement Fig. 3 Cloperastine reduce oxidative phosphorylation. A ROS levels of KYSE150 and KYSE450 after cloperastine treatment. Cells were treated with DMSO or cloperastine (25 µM) and fluorescence intensity was observed using a laser-scanning confocal microscope (Olympus FV1000). B JC-1 monomer and J-aggregate levels of KYSE150 and KYSE450 after cloperastine treatment. Cells were treated with DMSO or cloperastine (25 µM) and fluorescence intensity was observed using a laser-scanning confocal microscope (Olympus FV1000). Supplement Fig. 4 Cloperastine inhibits patient-derived xenograft tumor growth of ESCC in vivo. A The tumor volume per mouse in case EG20, LEG34, and LEG110, the tumor volume was measured every 3–5 days. B Effect of cloperastine on mouse body weight of case EG20, LEG34, and LEG110. The body weight was measured every 2-3 days. C Tumor growth inhibition of case EG20, LEG34, and LEG110. (*p < 0.05, **p < 0.01, ***p < 0.001).

