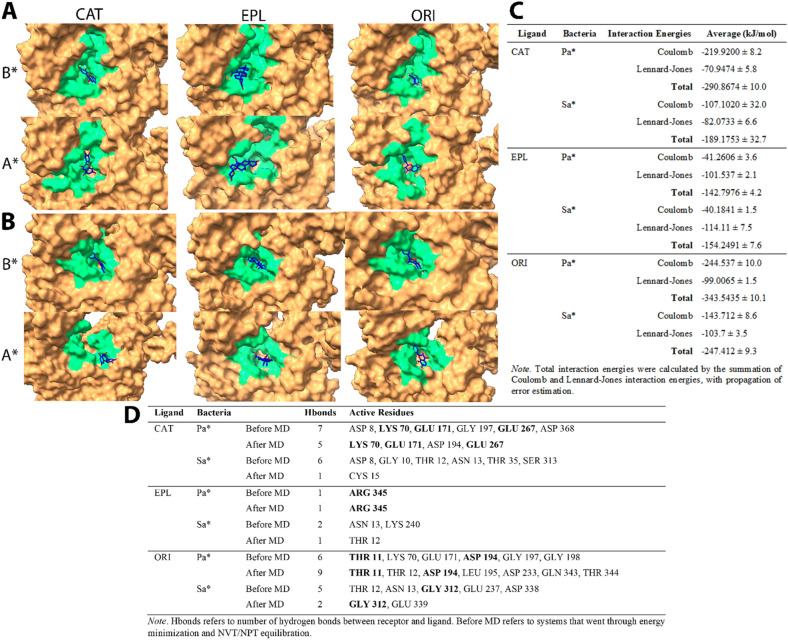
Figure 3.
MD simulation of (A) P. aeruginosa and (B) S. aureus DnaK (brown)-Catechin(blue) complexes, of which P2Rank predicted druggable pocket residues were colored in green for better visualization. (C) Tabulated interaction energy values of DnaK-Catechin complexes. (D) Tabulated changes in number of hydrogen bonds and active residues before and after MD. Note B*—Before MD, A*—After MD, Pa*—P. aeruginosa, Sa*—S. aureus, CAT—Catechin, EPL—Eplerenone, ORI—Oritin-4-beta-ol. All data were generated using GROMACS34 in-built functions.

