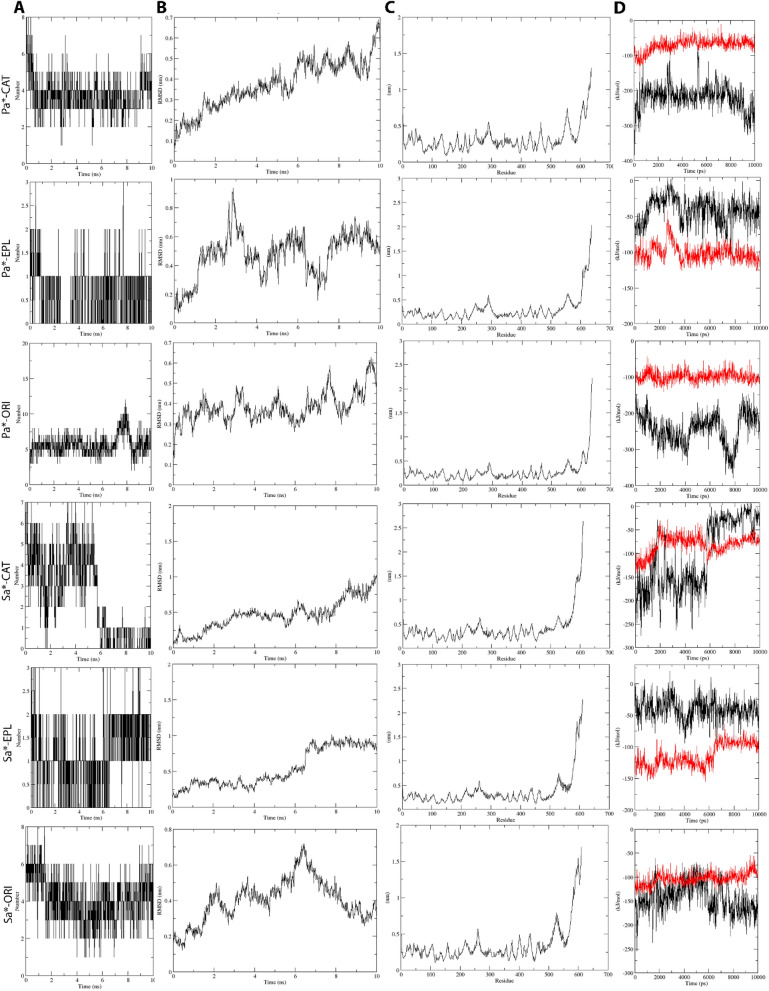
Figure 4.
Receptor-ligand interactions over the course of MD simulation, of which (A) number of hydrogen bonds between receptor and ligand, (B) RMSD values of Catechin, (C) RMS fluctuation-per-residue of receptor macromolecule, and (D) receptor-ligand interaction energies (Black: Coulombic interaction energies, Red: Lennard–Jones energies) were computed over the course of MD. Note Pa*—P. aeruginosa, Sa*—S. aureus, CAT—Catechin, EPL—Eplerenone, ORI—Oritin-4-beta-ol. All data were generated using GROMACS34 in-built functions.

