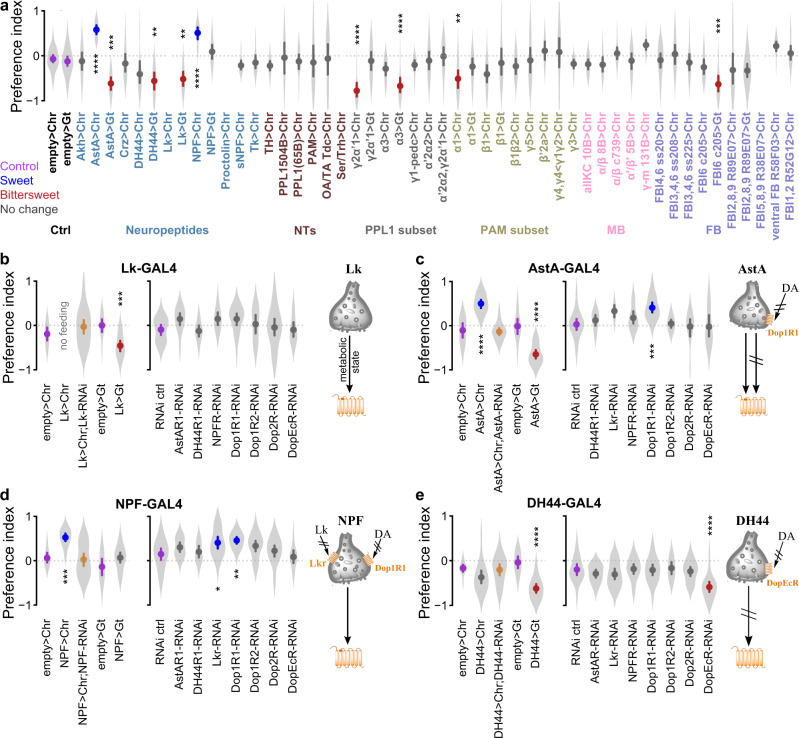
Fig. 2. A decision making neuronal ensemble revealed by combined optogenetic and chemoconnectomic strategy.
a Cell-specific optogenetic activation and inhibition screen was performed at the equal preference condition (50 mM sucrose vs. 500 mM sucrose + 1 mM quinine) using flies deprived of food for 21 h. Neuronal subsets were genetically targeted using the GAL4-UAS binary expression system. Red-light-sensitive CsChrimson (Chr) was used for optogenetic activation and green-light-sensitive GtACR1 (Gt) for optogenetic silencing. Optogenetic manipulation of AstA, DH44, Lk, and NPF neuropeptides; PPL1 γ2α’1, PPL1 α3, and PAM α1 dopaminergic subsets; and fan-shaped body layer 6 neurons (FBl6) significantly shifted preference away from equal preference compared to respective empty>Chr and empty>Gt controls. Purple mean point = control, blue mean point = significant sweet preference, red mean point = significant bittersweet preference, yellow mean point = simultaneous optogenetic activation and RNAi. b (left) Optogenetic activation of Leucokinin (Lk) neurons suppressed feeding in food deprived flies, while optogenetic inhibition shifted the preference towards bittersweet. Simultaneous Lk RNAi in Lk neurons abolished the suppression of feeding induced by optogenetic activation. b (right) RNAi in Lk neurons of analogous receptors for other candidate neuromodulators had no effect. c (left) Optogenetic activation of Allatostatin A (AstA) neurons shifted preference towards sweet while optogenetic inhibition shifted it towards bittersweet. Simultaneous AstA RNAi abolished the preference shift induced by optogenetic activation. c (right) Dop1R1 RNAi in AstA neurons shifted preference towards sweet. d (left) Optogenetic activation of NPF neurons shifted preference towards sweet. Simultaneous NPF RNAi abolished the preference shift induced by optogenetic activation. d (right) Lkr or Dop1R1 RNAi in NPF neurons each shifted preference towards sweet. e (left) Optogenetic activation of DH44 neurons had no effect on preference, while optogenetic inhibition shifted preference toward bittersweet. e (right) DopEcR RNAi in DH44 neurons shifted preference towards bittersweet. Schematics summarize the decision relevant information flow for specific neuropeptides. Plots show mean ± 95% CI, with violins depicting full data distribution; 5 ≤ trials ≤ 30 per violin, mode = 10. See Supplementary Table 1 for sample size and statistics. p < 0.00001 = ****, p < 0.0001 = ***, p < 0.01 = **, p < 0.05 = *.

