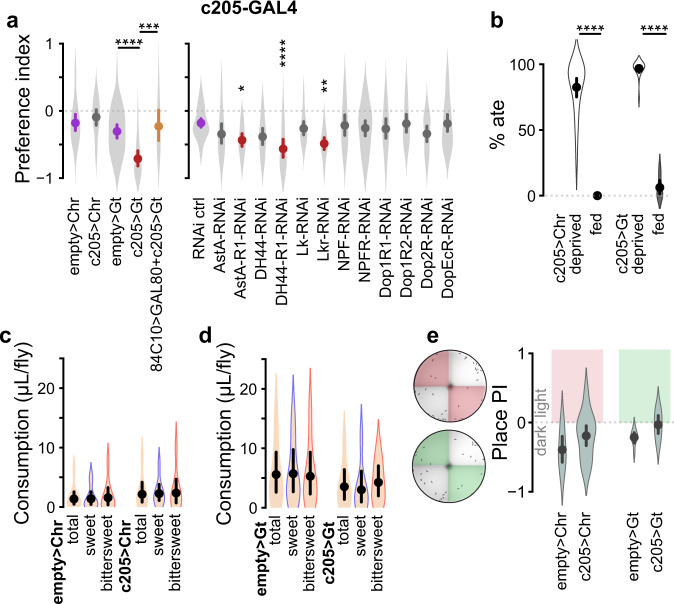
Fig. 3. Fan-shaped Body layer 6 is the convergence node of a decision making ensemble.
a (left) Optogenetic activation of FBl6 neurons did not affect preference. In contrast, optogenetic inhibition shifted preference towards bittersweet. Simultaneous repression of GAL4 expression in FBl6 neurons using GAL80 during optogenetic inhibition abolished the preference shift induced by optogenetic inhibition. This manipulation confirmed the role of FBl6 neurons in producing preference shift upon optogenetic inhibition. a (right) RNAi knockdown of AstA-R1, DH44-R1, or Lkr receptors in FBl6 shifted preference toward bittersweet. b Optogenetic activation or inhibition of FBl6 did not induce feeding in fed flies or prevent feeding in food-deprived flies. Optogenetic activation (c) or inhibition (d) of FBl6 did not change total food consumption per fly compared to respective empty-GAL4 controls. Food consumption was quantified by extracting red and blue food dyes from flies after the assay and measuring the extract absorbance using UV–vis spectrometry. Concentrations of individual dyes were calculated per trial by interpolating absorbance in the standard curve for each dye. Total volume of agarose ingested was then calculated from red and blue dye concentrations and divided by number of flies that ate red and blue food in that trial. Total food volume is the average of consumption by each fly regardless of type of food consumed. Within each group, there was no significant difference in sweet vs. bittersweet food consumption per fly. Optogenetic inhibition of FBl6 shifted preference towards bittersweet (a, left), because more flies consumed bittersweet than sweet. e Optogenetic activation or inhibition of FBl6 did not significantly change preference (place PI) of flies for illuminated vs. non-illuminated sectors of the arena, indicating that neither activation nor inhibition of FBl6 is inherently rewarding or punishing. Plots show mean ± 95% CI, with violins depicting full data distribution. Statistically different means are shown in different color as in Fig. 2. See Supplementary Table 1 for sample size and statistics. p < 0.00001 = ****, p < 0.0001 = ***, p < 0.01 = **, p < 0.05 = *.

