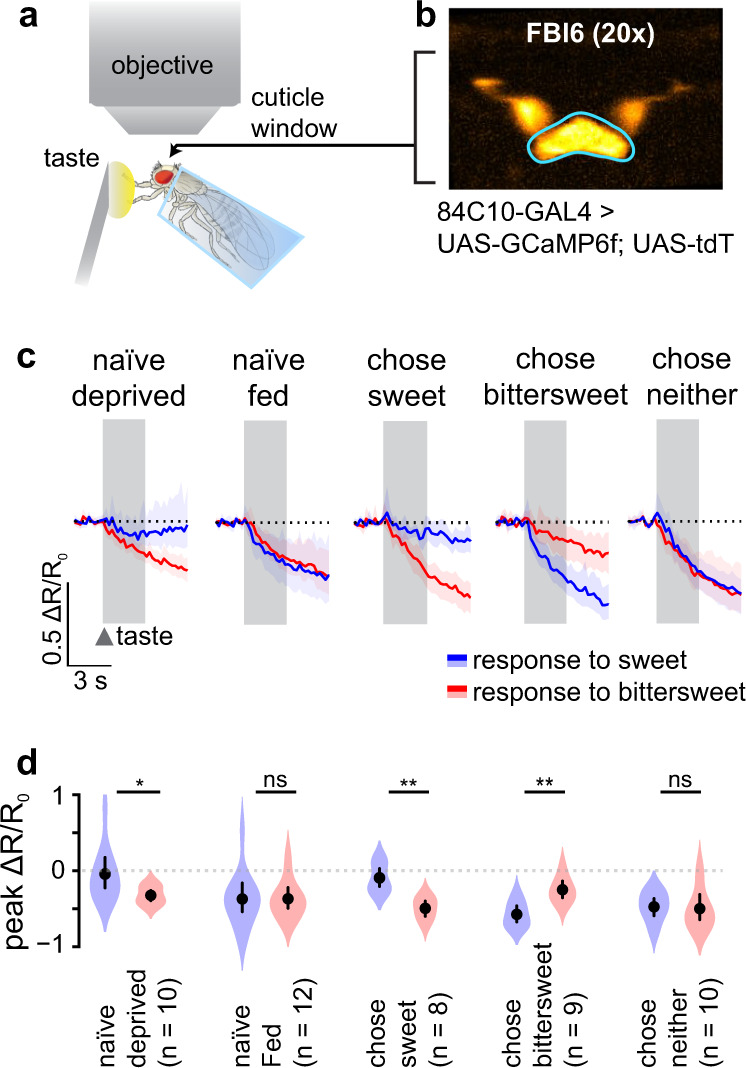
Fig. 4. Neural activity in FBl6 encodes food choice.

a In vivo Ca2+ imaging of taste responses in FBl6 neurons of flies in different hunger states making different sweet-bittersweet decisions. Sweet or bittersweet taste stimuli are applied to the forelegs, and changes in Ca2+ responses are measured ratiometrically in FBl6 using GCaMP6f and tdTomato. b Neuronal expression in FBl6 reported by tdTomato. Region of interest for fluorescence measurement is outlined in cyan. 84C10-GAL4 driver line is used to specifically target strong fluorescent protein expression in FBl6 neurons106,107 (Supplementary Fig. 3b–d). c Ratiometric calcium responses, ΔR/R0, of flies with different hunger state and decision outcomes. Sweet (50 mM sucrose) and bittersweet (500 mM sucrose + 1 mM quinine) taste stimuli from the equal-preference condition were applied for 3 s, and neural response was quantified for 4 s post-stimulus application. Taste stimulus application is indicated by gray background region. FBl6 neurons were strongly inhibited by the behaviorally rejected taste stimulus. Specifically, FBl6 neurons of flies that chose sweet were inhibited by bittersweet taste, while FBl6 neurons of flies that chose bittersweet were inhibited by sweet taste. c Calcium activity trace depicts mean ΔR/R0 ± 95% CI. d Peak ΔR/R0 shows significant difference between responses to rejected vs. chosen taste within each fly condition. p < 0.05 = * (see Supplementary Table 1 for details on statistics). Points on graphs depict mean ± 95% CI, with violins depicting full data distribution.
