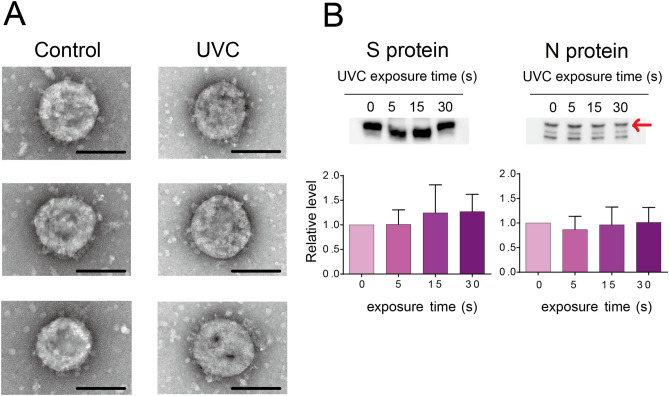
Figure 3.
Effect of ultraviolet C (UVC) irradiation on viral morphology and viral proteins. (A) Representative viral particle images analyzed by transmission electron microscopy (TEM, three pictures for each group). SARS-CoV-2 (1 mL) with a titer of 1.78 × 10⁶ 50% tissue culture infective dose (TCID50/mL) was irradiated with a UVC light tube for 60 s and then analyzed by TEM (Scale bar of 100 nm). (B) Representative immunoblot images of viral spike (S) and nucleocapsid (N) proteins. SARS-CoV-2 (1 mL) with a titer of 1.78 × 10⁶ TCID50/mL was irradiated with a UVC light tube for increasing periods of time from 0 to 30 s. Equal volumes of irradiated virus suspension were then used for immunoblotting analysis using anti-SARS-CoV-2 spike monoclonal antibody (1A9) and anti-SARS-CoV-2 nucleocapsid monoclonal antibody (6H3) (upper panel). Positions of the S and N proteins are indicated. Full-length blots are shown in Supplementary Fig. S1. The intensity of both proteins is analyzed using CS Analyzer 4 software and quantitative results are shown in the bar diagram (lower panel). Data in the plot represent the mean ± standard deviation (SD) of three replicates. Significance has been determined using one-way analysis of variance followed by Dunnett’s multiple comparisons test.

