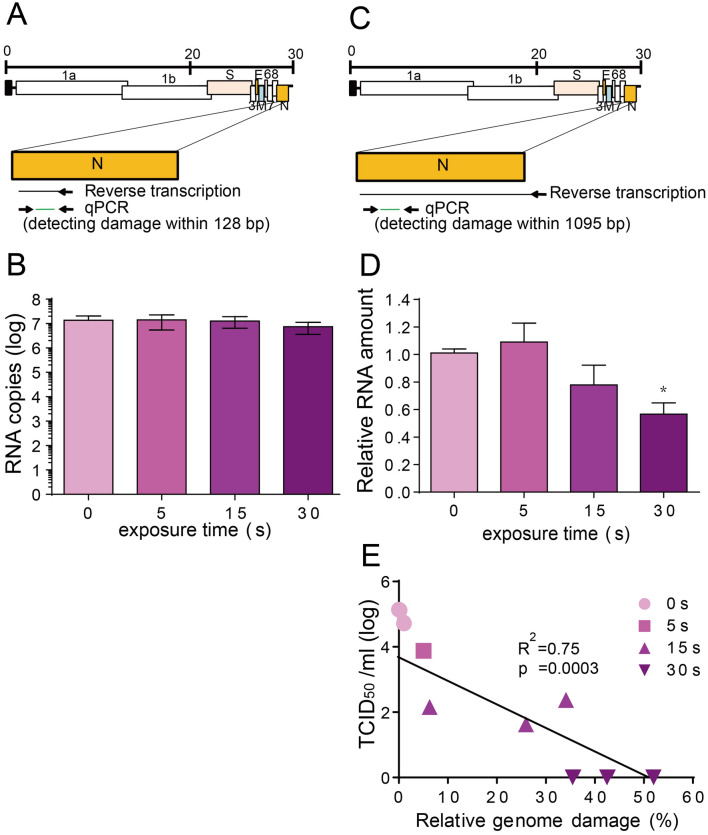
Figure 4.
Reverse-transcription quantitative-polymerase chain reaction (RT-qPCR) to determine the effect of ultraviolet C (UVC) irradiation on the viral genome. (A) Schematic diagram of the conventional RT-qPCR RT-priming site and qPCR primer sites. (B) Quantitative results of conventional RT-qPCR. SARS-CoV-2 (5 mL) with a titer of 5 × 10⁴ 50% tissue culture infective dose (TCID50/mL) was irradiated with a UVC light tube for increasing periods of time from 0 to 30 s; the viral RNA was extracted and then viral RNA copy number was determined. (C) Schematic diagram of the long RT-qPCR RT-priming site and qPCR primer sites. (D) Quantitative results of long RT-qPCR. SARS-CoV-2 (5 mL) with a titer of 5 × 10⁴ TCID50/mL was irradiated with a UVC light tube for increasing periods of time from 0 to 30 s. The relative RNA fold change compared to 0 s irradiation is calculated. Data in the plot represent the mean ± standard deviation (SD) of three replicates. Significance has been determined using one-way analysis of variance followed by Dunnett’s multiple comparisons test. The asterisk indicates a statistical difference (*p < 0.05). (E) Linear regression analysis between relative viral genome damage and virus infectivity (derived from Fig. 2A) based on the long-RT-qPCR results. Relative genome damage is calculated as follows: (1-relative RNA fold change compared to control) × 100%. The data points that outside the axis limits are not shown in the graph.

