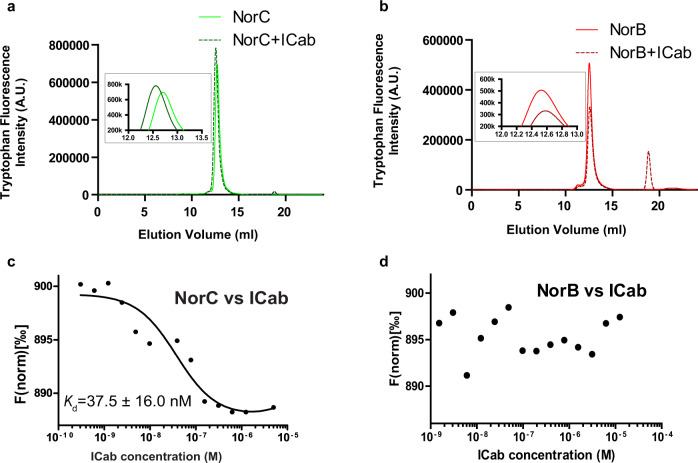
Fig. 3. ICab specifically interacts with NorC.
a Tryptophan fluorescence trace of NorC in FSEC, shifts to a slightly higher molecular mass when complexed with ICab. b NorB does not display a shift indicating a lack of interaction with ICab (inset). c, d Corresponding MST profiles of NorC and NorB respectively with Kd = 37.5 ± 16 nM for ICab and NorC but no detectable affinity for NorB. n = 2 for NorB vs ICab titration and n = 3 for NorC vs ICab for independent replicates. Source data are provided in the source data file.

