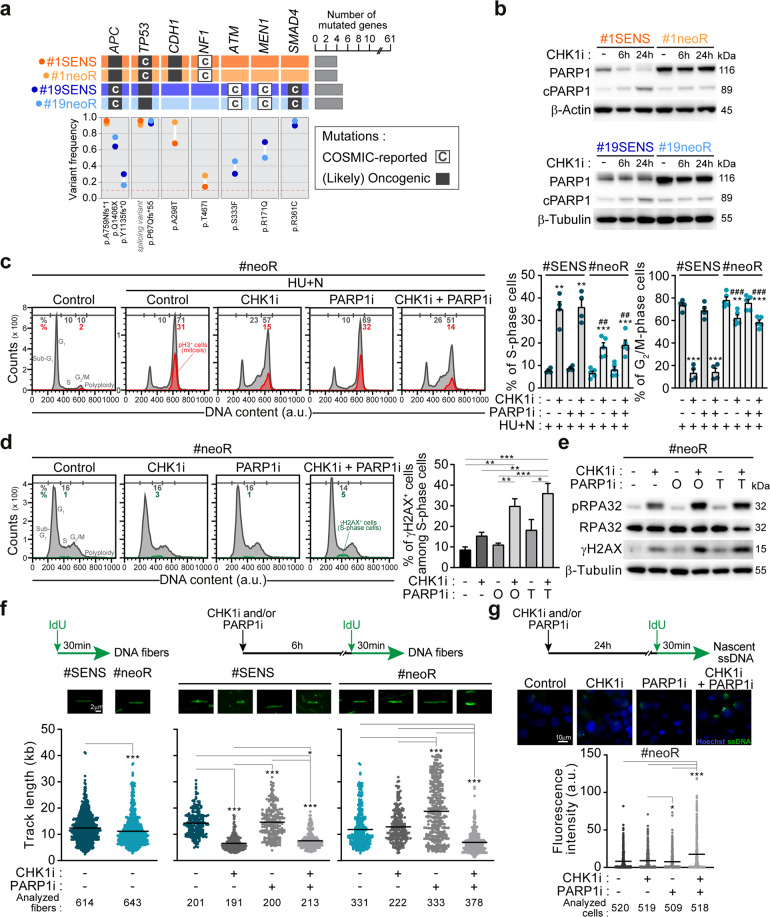
Fig. 3. PARP1 is upregulated and modulates DNA replication speed in neoR-CRC-SCs.
a Oncoprint of mutations for 61 DDR-related genes in neoR-CRC-SCs and SENS-CRC-SCs identified by deep sequencing. Only mutations included in COSMIC (“C”; http://cancer.sanger.ac.uk/cosmic) and/or annotated as (likely) oncogenic (dark gray squares) in the oncoKB database (https://oncokb.org/) are reported. Mutated gene number and allelic frequencies per CRC-SC are shown. Full gene list is in Supplementary Table S3. b Western-blot analysis in neoR-CRC-SCs and SENS-CRC-SCs left untreated or administrated for 6 h or 24 h with 100 nM prexasertib (CHK1i) and then stained with antibodies recognizing PARP1 and β-Actin or β-Tubulin (to ensure equal lane loading). cPARP1, cleaved PARP1. c Flow cytometry analysis in one representative CRC-SC pair (#1SENS/neoR) left untreated or sequentially treated with 1 mM hydroxyurea (HU) and, after drug washout, with 1 µM nocodazole (N) alone or together with CHK1i and/or PARP1i (talazoparib, TZ) (the HU + N assay, see Fig. 2a). Cell cycle profiles for #1neoR and quantification of S- and G2/M-phase cells for #1neoR and #1SENS are shown. Mitotic (pH3+) cells are in red. Results are expressed as means ± SEM and individual data points of 4 (#1SENS) or 5 (#1neoR) independent experiments. Cell cycle profiles of #1SENS are in Supplementary Fig. S4b. *P < 0.05, **P < 0.01, ***P < 0.001 (one-way ANOVA and Bonferroni or Dunnett T3 post-hoc test) compared to HU + N-treated conditions. #P < 0.05, ##P < 0.01, ###P < 0.001 (unpaired t-test) compared to SENS-CRC-SCs. d, e Flow cytometry and immunoblot analysis of RS markers in neoR-CRC-SCs left untreated or treated with CHK1i and/or olaparib (O) or TZ (T) for 24 h (d) or 72 h (e) and stained with antibodies recognizing γH2AX, pRPA32, RPA32 and/or DAPI. Cell cycle profiles and quantification of γH2AX+ S-phase cells are reported in d. Results are means ± SEM of 5 independent experiments. *P < 0.05, **P < 0.01, ***P < 0.001 (one-way ANOVA and Bonferroni post-hoc test) as indicated (d). In e, β-Tubulin was used to ensure equal lane loading. See also Supplementary Fig. S4c. f DNA fiber assay in representative neoR/SENS-CRC-SCs (#19) left untreated or treated for 6 h with CHK1i and/or TZ and labeled with 250 µM IdU for the last 30 min. Representative DNA fiber images and dot-plots of IdU-labeled tract lengths for only untreated cells (left) or all conditions (right) are shown. Number of well-isolated DNA fibers per condition is reported. Data were pooled from four (left) and two (center and right) independent experiments (see Materials and Methods), and shown as box-plots with means and individual data points. *P < 0.05, **P < 0.01, ***P < 0.001, Mann–Whitney test for the comparison neoR-CRC-SCs vs. SENS-CRC-SCs (left), and Kruskal–Wallis ANOVA followed by Dunn’s post-hoc test for comparisons within neoR or SENS groups (center/right). g Immunofluorescence detection of nascent ssDNA in neoR-CRC-SCs left untreated or exposed to CHK1i and/or TZ for 6 h, labeled for the last 30 min of the treatment with 250 µM IdU, and finally stained with an anti-BrdU antibody. Representative images and quantification of cells displaying nascent strands (BrdU+) are shown. Data were pooled from two independent experiments and shown as box-plots with means and individual data points. Number of analyzed cells per condition is reported. *P < 0.05, **P < 0.01, ***P < 0.001 (Kruskal–Wallis ANOVA followed by Dunn’s post-hoc test). Dose range in c–g: 100–200 nM CHK1i, 5 µM OLA, 300–500 nM TZ; a.u. arbitrary units. All significant P values are shown in Supplementary Table S4. Supplementary figures associated: Supplementary Fig. S4.

