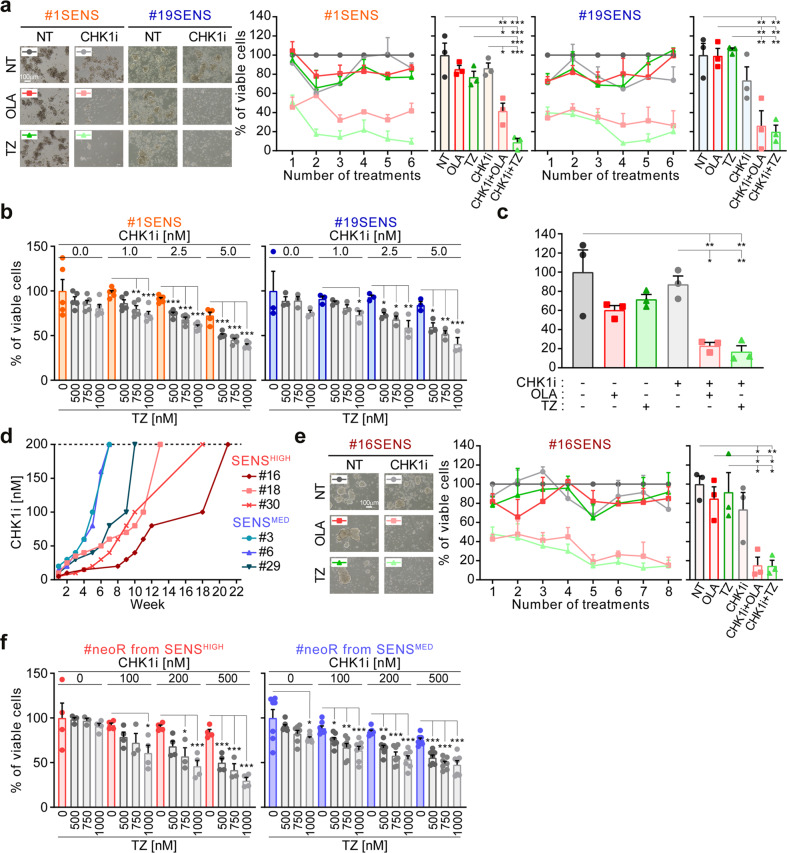
Fig. 6. PARP1 inhibition prevents the generation of resistance to CHK1 inhibitors in CRC-SCs.
a Cell viability of SENS-CRC-SCs left untreated or subjected to consecutive rounds of 72 h-treatment with prexasertib (CHK1i) alone or in combination with olaparib (OLA) or talazoparib (TZ) followed by ≥4 days of cultivation in drug-free medium, as described in Materials and Methods and Supplementary Fig. S6a. After each round of treatment, viable cells were counted upon Trypan Blue staining. Representative images and quantitative data of the percentage of viable cells at each treatment point or at the last time point are shown. Data are expressed as means ± SEM of 3 independent experiments. For the last time points, individual data points are also reported. The three individual experiments are in Supplementary Fig. S6b. *P < 0.05, **P < 0.01, ***P < 0.001 (one-way ANOVA and Bonferroni post-hoc test) compared to untreated conditions. Doses employed: CHK1i 1-30 nM; OLA 2-7 µM; TZ 100-500 nM. b Cell viability (assessed by CellTiter-Glo® assay) of SENS-CRC-SCs left untreated or treated with sublethal doses of CHK1i and/or PARP1i for 96 h, as indicated. Results are reported as means ± SEM and individual data points from 5 (on the left) and 3 (on the right) independent experiments. *P < 0.05, **P < 0.01, ***P < 0.001 (one-way ANOVA and Bonferroni post-hoc test) as indicated. c Clonogenic survival of SENS-CRC-SCs left untreated or pre-treated for 72 h with 10 nM CHK1i, 5 µM OLA and/or 300 nM TZ. Quantitative data (#1SENS and #19SENS pooled) are shown. Results are reported as means ± SEM and individual data points from 3 independent experiments. *P < 0.05, **P < 0.01, ***P < 0.001 (one-way ANOVA and Bonferroni post-hoc test) as compared to the corresponding untreated CRC-SCs. Representative images are in Supplementary Fig. S6c. d Dynamics of the acquisition of resistance in SENSHIGH-CRC-SCs and SENSMED-CRC-SCs exposed to multiple rounds of CHK1i treatment using the protocol of Fig. 1a. CRC-SCs were considered resistant when they became insensitive to 200 nM CHK1i (dotted line: threshold). See also Supplementary Fig. S6e. e One representative SENS-CRC-SCs (#16SENS) was left untreated or subjected to consecutive rounds of treatments as in a. Representative images as well as quantitative data of the percentage of viable cells at each round of treatment(s) or at the last time point are shown. Data are expressed as means ± SEM of 3 independent experiments. Individual data points are also shown for the last time point. The three individual experiments are reported in Supplementary Fig. S6f. Data are analyzed as in a. f Cell viability of some neoR-CRC-SCs reported in panel d exposed for 96 h to CHK1i and/or TZ as indicated. Results are expressed as means ± SEM and individual data point from 4 independent experiments (on the left, with the exception of the 750 nM TZ-treated conditions in which is 3) and 7 independent experiments (on the right). Data on the right are pooled (#3+#6+#29neoR), while, on the left, results for #30neoR are reported. *P < 0.05, **P < 0.01, ***P < 0.001 (one-way ANOVA and Bonferroni or Dunnett T3 post-hoc test) as indicated. All significant P values are shown in Supplementary Table S4. Supplementary figures associated: Supplementary Fig. S6.

