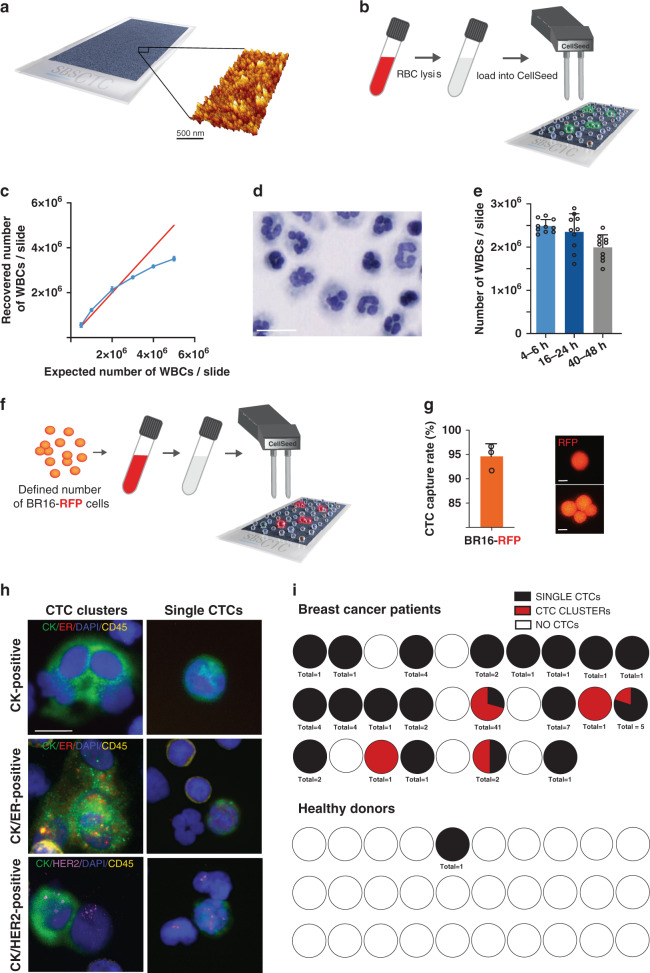
Fig. 1. Setup of SBS-CTC technology for shear-free CTC capture.
a Graphical representation of the SBS surface and its corresponding 3D structure. b Schematic representation of CTC capture strategy with the CellSeed device. CTCs and WBCs are seeded and captured on the SBS-CTC slides after RBCs depletion. c WBC adhesion efficiency curve on SBS-CTC slide; the recovered number of WBC/slide has been plotted versus the expected number of WBC/slide for six WBC concentrations (n = 3). Error bars represent SD. The linear regression was calculated: y = −1E−07x2 + 1.2441x−28887, R2 = 0.999. d Representative image of Papanicolaou-stained WBCs and corresponding cell morphology and distribution (scale bar 20 μm). e Influence of sample processing time on WBCs adhesion efficiency. Sample processing time points have been set at 4–6 h, 16–24 h and 40–48 h upon the blood draw. Box plots showing mean value of WBCs adhered to SBS (n = 10 for all, 5 slides/each sample). Error bars represent SD. f Graphical representation of the procedure to assess CTC capture rate on SBS-CTC slides. A defined number of BR16-RFP single and clustered CTCs were spiked into healthy donor blood and processed with CellSeed to assess on-slide capture rate. g Plot showing the capture efficiency of the SBS-CTC surface using CellSeed device for BR16-RFP cells spiked in healthy donor blood samples (left; error bars represent SD). Representative images of captured BR16-RFP single and clustered cells are shown (right; scale bar 10 μm). h Representative immunofluorescence images of captured CTC clusters (top) and single CTCs (bottom) stained for pan-cytokeratin (CK, green), oestrogen receptor α (ER, red) and DAPI (nuclei, blue). The same cells were also interrogated for ErbB2 gene amplification by fluorescence in situ hybridisation (HER2, magenta). White blood cells were stained for CD45 (yellow). Scale bar (10 μm). i Pie charts showing the raw distribution of detected single CTCs (black) and CTC clusters (red) in each analysed blood sample. The total number of CTCs is shown (bottom).

