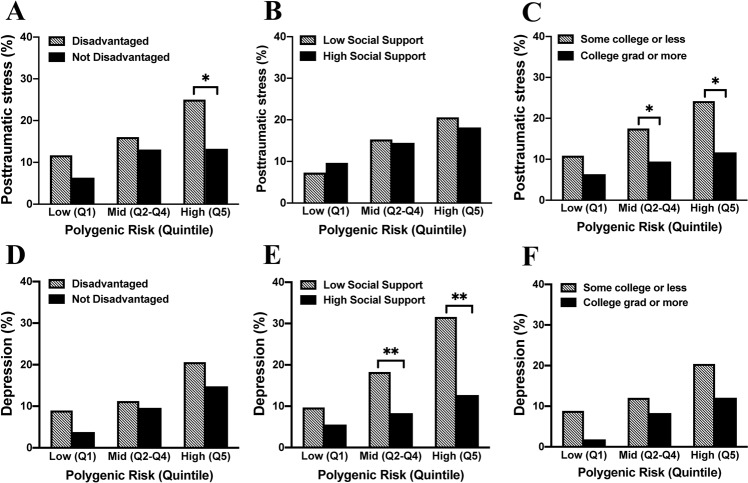
Fig. 3. Prevalence of posttraumatic stress (PTS) and depressive symptoms (DS) 6 months following motor vehicle collision (MVC) trauma based on PTSD GWAS polygenic risk scores and the effect that three social factors have on this genetic vulnerability to PTS and DS.
Prevalence of PTS (A–C) and DS (D–F) were graphed for each polygenic risk group (defined by quintiles as presented in Supplementary Fig. S4, with the second, third, and fourth quintiles grouped in the “Mid” risk category). A, D Influence of living in a disadvantaged neighborhood (striped bars) vs. a non-disadvantaged neighborhood (black bars) on genetic risk for PTS and DS. B, E Influence of social support on genetic risk for PTS and DS (striped bars represent low social support and black bars represent high social support). C, F Influence of education level on genetic risk for PTS and DS (striped bars represent some college or less and black bars represent college education or higher). Significance of equality of proportions models within each polygenic risk category are indicated above relevant bars; *p < 0.05, **p < 0.01.

