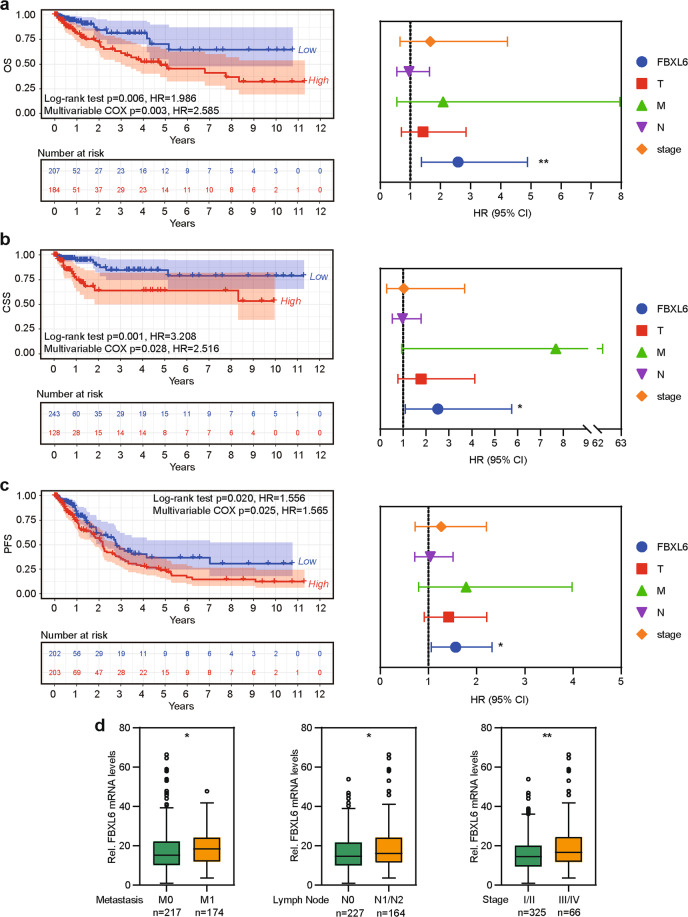
Fig. 2. FBXL6 up-regulation predicts poor prognosis in CRC patients.
a–c Kaplan–Meier curves showing the OS (a), CSS (b), and PFS (c) of human CRC based on FBXL6 expression in CRC tissues from TCGA database (left). Multivariate Cox regression analysis of OS (a), CSS (b), and PFS (c) in CRC from TCGA database (right). d Relative expression of FBXL6 grouped by distal metastases, lymph node involvement, and stage in CRC samples from TCGA database. Boxplots show median, quartiles, min, and max. p values of boxplots are based on the Mann–Whitney test. *p < 0.05, **p < 0.01.

