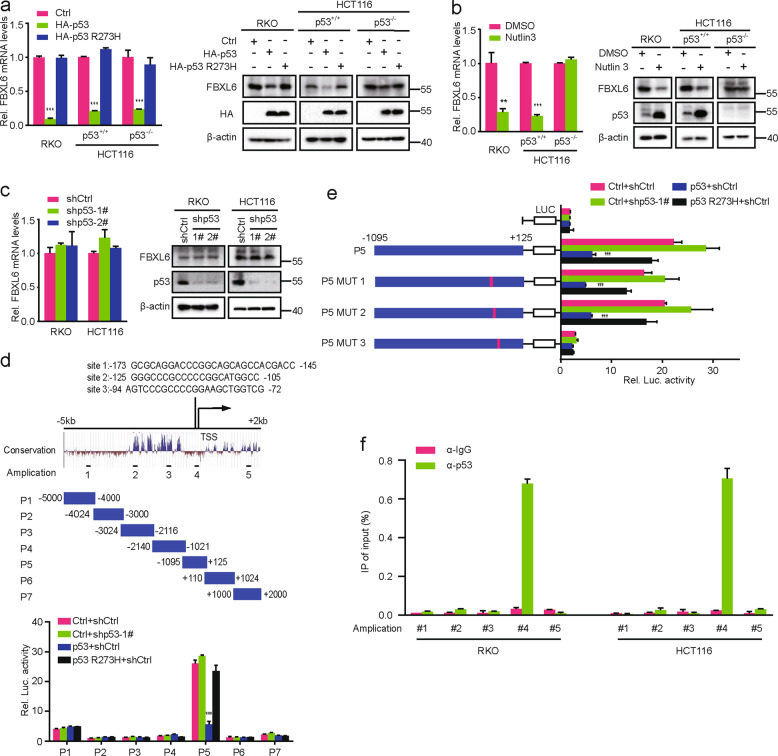
Fig. 7. p53 binds to the FBXL6 gene’s core promoter and transcriptionally suppresses its expression.
a–c FBXL6 mRNA levels were analyzed by qRT-PCR in RKO, HCT116, and HCT116 (p53−/−) cells which were transfected with the indicated plasmids and treated with Nutlin 3 where indicated. GAPDH was used as a loading controls (left). The above cells were transfected with the indicated plasmids and treated with Nutlin 3 where indicated. Then cells were harvested for IB analysis, with β-actin as a loading control (right). d Schematic representation of the FBXL6 promoter regions 5 kb upstream and 2 kb downstream of the TSS (above). Dual-luciferase assays in HEK293 cells transfected with the indicated plasmids (below). e Dual-luciferase assays in HEK293 cells transfected with the indicated plasmids. f Anti-p53 ChIP-qPCR analysis in RKO and HCT116 cells treated with Nutlin 3. Results are shown as the means ± SD. *p < 0.05, **p < 0.01, ***p < 0.001.

