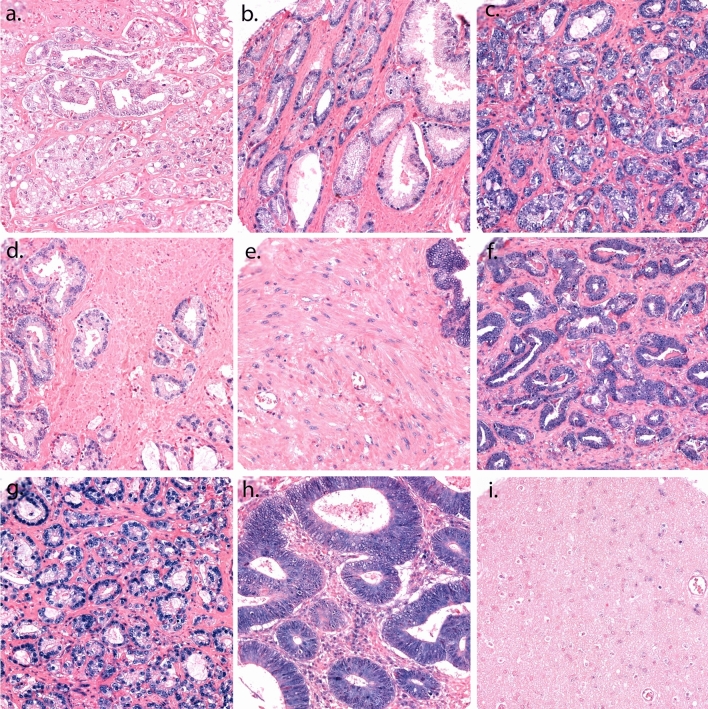
Figure 2.
A panel of representative cores with scoring of tumor epithelium and tumor stroma for miR-17-5p stained by ISH. TE is scored by the intensity of the staining in the cell cytoplasm and core, with values from 0–3, and TS is scored by the density of positive cells in the examined core. (a) Score 1 in TE; (b) Score 2 in TE; (c) Score 3 in TE; (d) Score 1 in TS; (e) Score 2 in TS; (f) Score 3 in TS; (g) U6 control staining; (h) Positive tissue control: normal human colon tissue; (i) Negative tissue control: normal human brain tissue. Magnification 20x.

