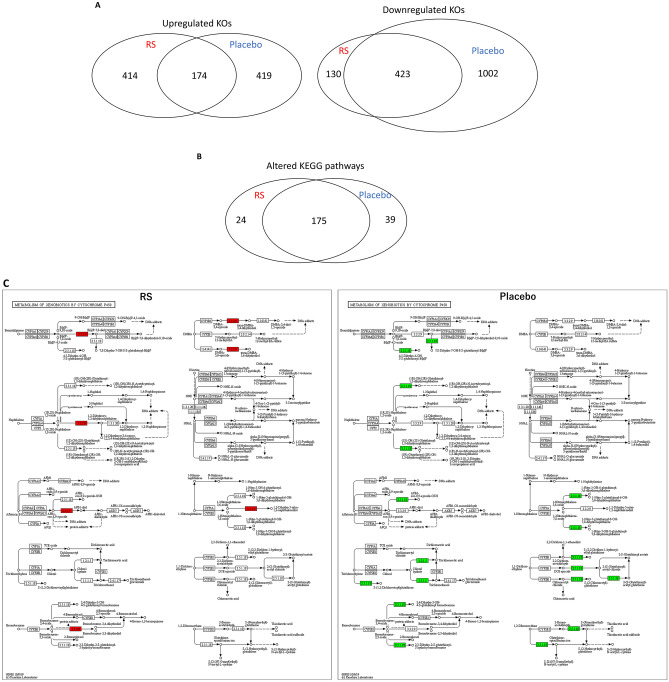
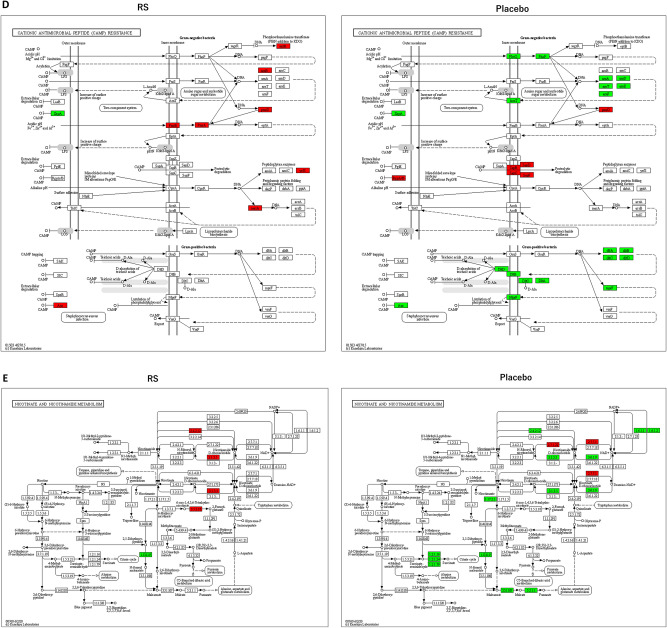
Figure 5.
Alternation of microbial KEGG pathways in RS group. (A) Venn diagram analysis of altered KEGG orthologues (KOs) identified PICRUSt analysis. (B) Venn diagram analysis of KEGG pathways predicted by KEGG Mapper. (C–E) Several KEGG pathways were up-regulated in RS group compared with those of the placebo group. Metabolism of xenobiotics by cytochrome P450 (C), cationic anti-microbial peptide (CAMP) resistance (D), and nicotine and nicotiamide metabolism (E). Red and green indicates up-regulation and down-regulation, respectively.


