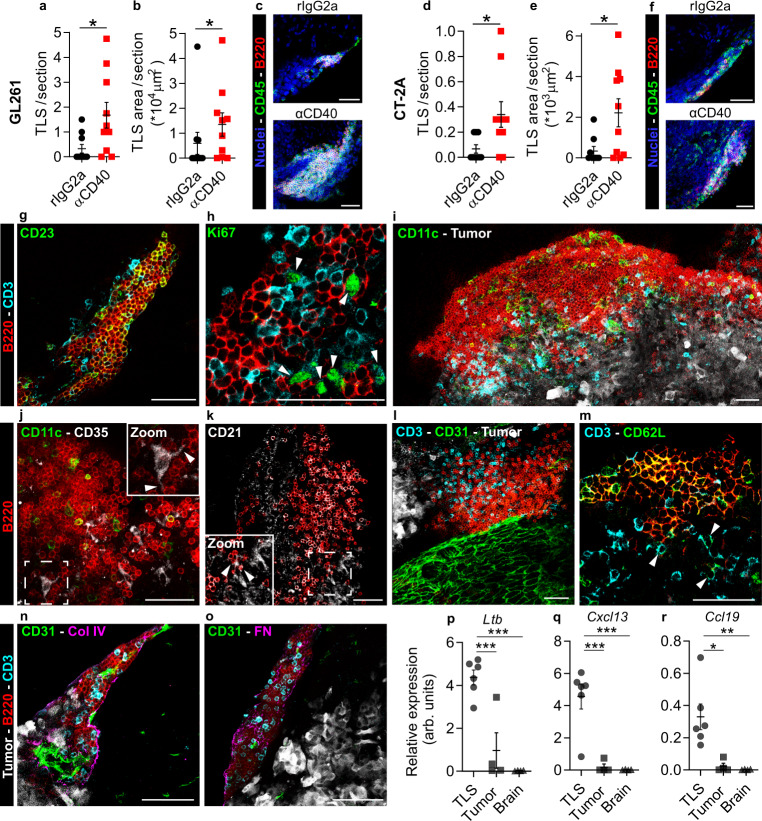
Fig. 1. αCD40 induced formation of tertiary lymphoid structures (TLS) in the brain of GL261 and CT-2A glioma-bearing mice.
Quantification of (a, d) the number (p = 0.0166; p = 0.0106 respectively) and (b, e) the total CD45+ surface area (p = 0.0415; p = 0.0216, respectively) of dense CD45+B220+ clusters per 80µm-thick section, in the brain of GL261 and CT-2A tumor-bearing mice. In a, b, n = 10mice/group. In d, e, n(rIgG2a) = 9 mice, n(αCD40) = 10 mice. Two-tailed Mann–Whitney test. c, f Representative immunofluorescent stainings of the quantified CD45+B220+ clusters in the GL261 and CT-2A models. Scale bars: 50 µm. g–o Immunofluorescent stainings of αCD40-induced TLS in the GL261 model showing TLS composition and organization. All images are representative of four independent experiments and 8 mice, and were taken from samples collected at the survival endpoint, between day 23 and day 35 post-tumor implantation (4–16 days after the last αCD40 treatment). Arrows in h indicate Ki67+ T cells. Arrows in j indicate dendrites of a CD35+ FDC interacting with surrounding B cells. Arrows in k indicate a CD21+ FDC interacting with surrounding B cells. Scale bars: 50 µm. p–r Gene expression of TLS-inducing cytokines in laser capture micro-dissected CD45+B220+ clusters, compared with laser capture micro-dissected tumor tissue and normal brain tissue. arb. units = arbitrary units. n(TLS) = 6 LMD areas, n(tumor) = 4 LMD areas, n(brain) = 4 LMD areas. p p(TLS vs. tumor) = 0.0009, p(TLS vs. brain) = 0.0001. q p(TLS vs. tumor) = 0.0007, p(TLS vs. brain) = 0.0005. r p(TLS vs. tumor) = 0.0115, p(TLS vs. brain) = 0.0077. One-way ANOVA with Tukey’s multiple comparison correction. In a, b, d, e, black circle indicates rat IgG2a (rIgG2a) and red square indicates agonistic CD40 antibodies (αCD40). In p–r, black circle indicates TLS, black square indicates Tumor and black triangle indicates Healthy brain tissue. For all graphs in this figure, *p < 0.05, **p < 0.01, ***p < 0.001. Bars: mean ± SEM. Source data are provided as a Source Data file.

