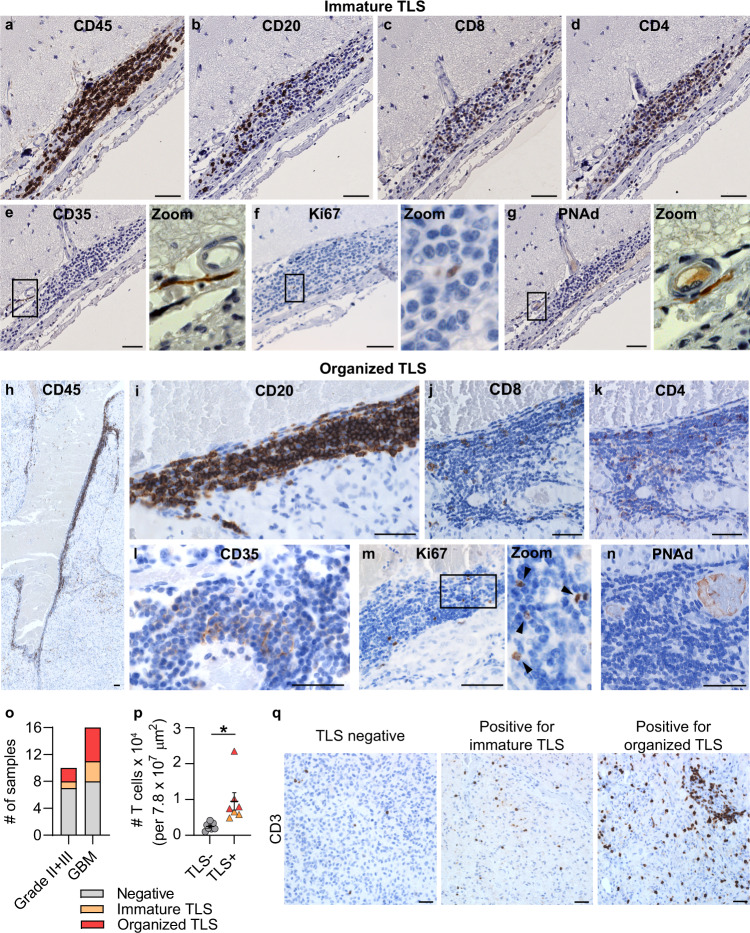
Fig. 3. Tertiary lymphoid structures were present in the brain of glioma patients and were associated with increased T cell abundance.
Immunohistochemical stainings of human glioma sections showing the composition of (a–g) immature TLS characterized by a loose B cell core and (h–n) organized TLS characterized by a compact core of B cells. Black square areas in e–g and m are magnified to the right of each image. Scale bars: 50 µm. a, b Representative of 21 immature TLS. h, i Representative of 16 organized TLS. Stainings in c–g and j–n were performed on one representative immature TLS and one representative organized TLS. o Number of grade II/grade III glioma patients and glioblastoma (GBM) patients included in our cohort that stained negative for TLS (gray), positive for immature TLS (orange) or positive for organized TLS (red). n(Grade II + III, negative) = 7, n(Grade II + III, immature TLS) = 1, n(Grade II + III, organized TLS) = 2, n(GBM, negative) = 8, n(GBM, immature TLS) = 3, n(GBM, organized TLS) = 5. p Number of T cells infiltrating the tumor area in GBM patients negative for TLS (gray circle) versus GBM patients positive for TLS (orange triangle: immature TLS; red triangle: organized TLS). n = 7 patients/group. p = 0.0142. Two-tailed t-test. Bars: mean ± SEM. q Representative images of T cell infiltration in GBMs that were negative for TLS, positive for immature TLS or positive for organized TLS. Scale bars: 50 µm. For all graphs in this figure, *p < 0.05. Source data are provided as a Source Data file.

