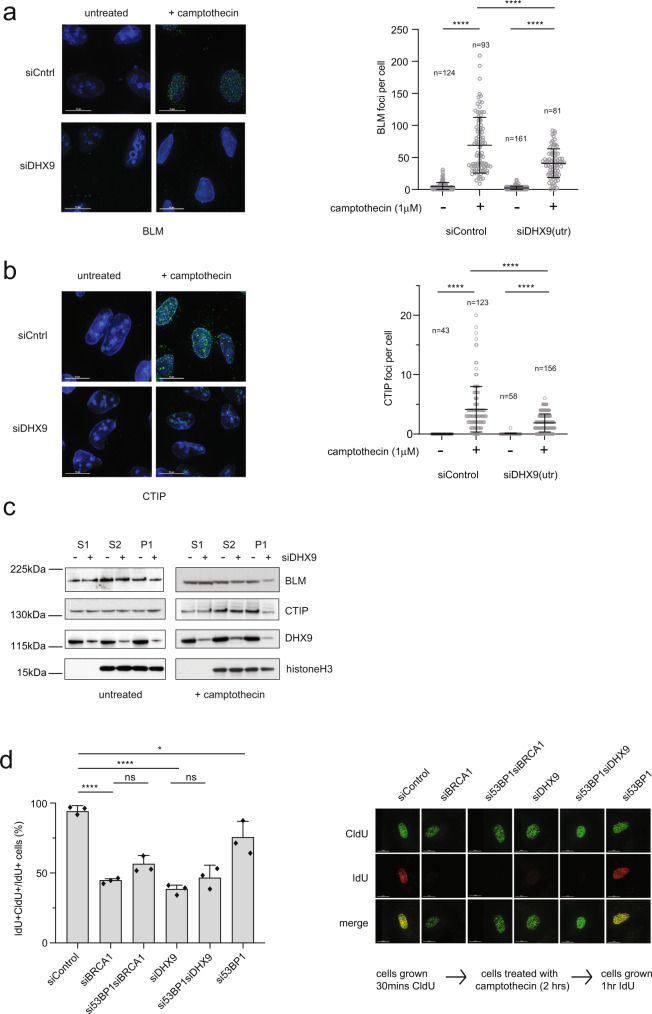
Fig. 9. DHX9 promotes the recruitment of CTIP and BLM to DNA damage.
a Fluorescence images (left panel) and graph (right panel) showing that localization of BLM to camptothecin-induced DNA damage foci is impaired in cells knocked down for DHX9. b Fluorescence images (left panel) and graph (right panel) showing that localization of CTIP to camptothecin-induced DNA damage foci is impaired in cells knocked down for DHX9. Quantification of n cells (as indicated) from three pooled biologically independent experiments were performed in (a) and (b). Means were shown to be significantly different using one-way ANOVA with post hoc Tukey’s test (****p < 0.0001). c Western blot of fractionated cell extracts showing that localization of BLM and CTIP to chromatin (P1 fraction) in response to camptothecin-induced DNA damage is reduced in cells knocked down for DHX9. Localization of BLM and CTIP in cytoplasmic (S1) and nuclear fractions (S2) is not decreased. Histone H3 is shown as a marker of S2 and P1 fractions. d DNA synthesis is impaired in DHX9 and BRCA1 deficient cells treated with camptothecin (5 μM for 2 h). This defect is not suppressed by knockdown of 53BP1 Right panel shows representative images for the incorporation of CldU and IdU nucleotide analogs as well as merged images. The left panel shows graphical data of cells stained with both CldU and IldU as a percentage of total cells stained with CldU. Graphs include data from three biologically independent experiments. Mean and error bars indicating one standard deviation are also indicated. Statistical significance for all experiments was demonstrated using one-way ANOVA with post hoc Tukey’s test (****p < 0.0001, *p < 0.1, ns not significant). Source data are provided as a Source Data file.

